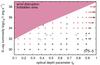
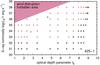
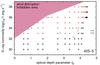
Fig. 1
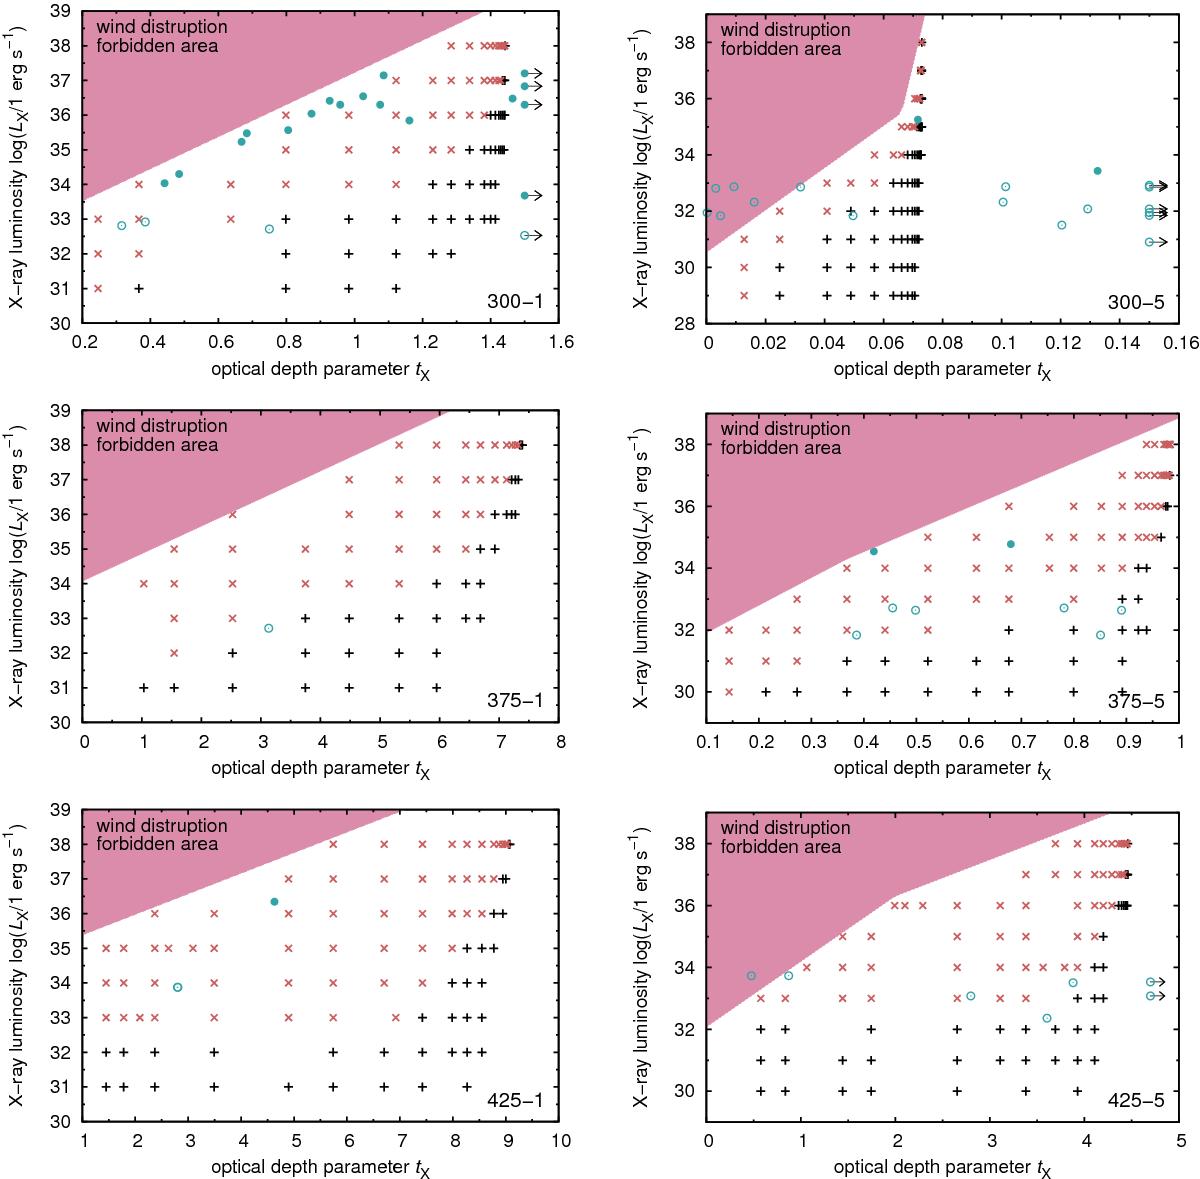
Regions with different effect of the X-ray irradiation in the diagrams of X-ray luminosity (LX) vs. the optical depth parameter (tX). Graphs are plotted for individual model stars in Table 1. Individual symbols denote positions of: models with negligible influence of X-ray irradiation (black plus, +), models where X-ray irradiation leads to the decrease of the wind terminal velocity (red cross, ×), non-degenerate components of HMXBs from Table 4 (filled circles, •), and individual components of X-ray binaries from Table 5 (empty circles, ⊙). The regions of the LX − tX parameters that lead to the wind inhibition are denoted using the shaded area (■).
Current usage metrics show cumulative count of Article Views (full-text article views including HTML views, PDF and ePub downloads, according to the available data) and Abstracts Views on Vision4Press platform.
Data correspond to usage on the plateform after 2015. The current usage metrics is available 48-96 hours after online publication and is updated daily on week days.
Initial download of the metrics may take a while.