Fig. 9
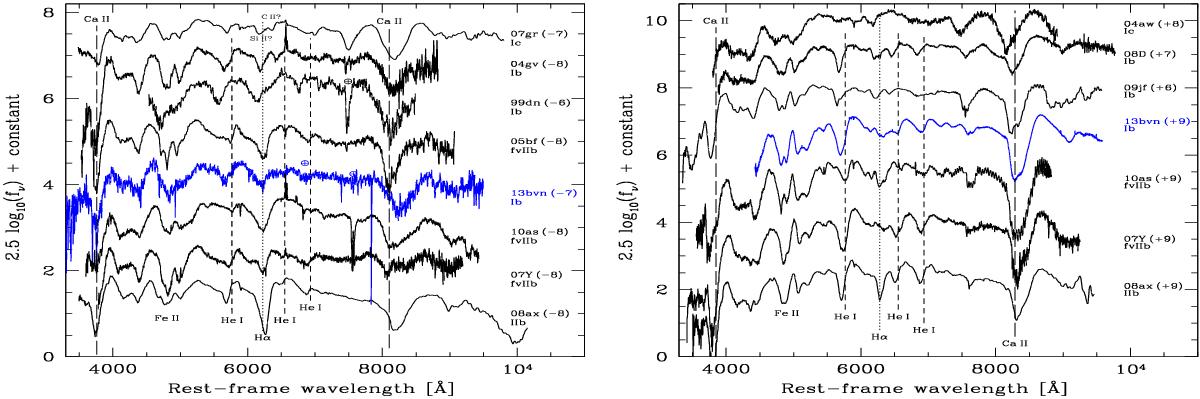
Early spectra of iPTF13bvn at around one week before and after maximum light, compared to other stripped-envelope SNe. Vertical dashed lines show the positions of prominent helium lines, and the dotted line shows the position of high-velocity Hα. The spectra were taken from the Weizmann Interactive Supernova Data Repository (WISeREP; Yaron & Gal-Yam 2012)
Current usage metrics show cumulative count of Article Views (full-text article views including HTML views, PDF and ePub downloads, according to the available data) and Abstracts Views on Vision4Press platform.
Data correspond to usage on the plateform after 2015. The current usage metrics is available 48-96 hours after online publication and is updated daily on week days.
Initial download of the metrics may take a while.