Fig. 3
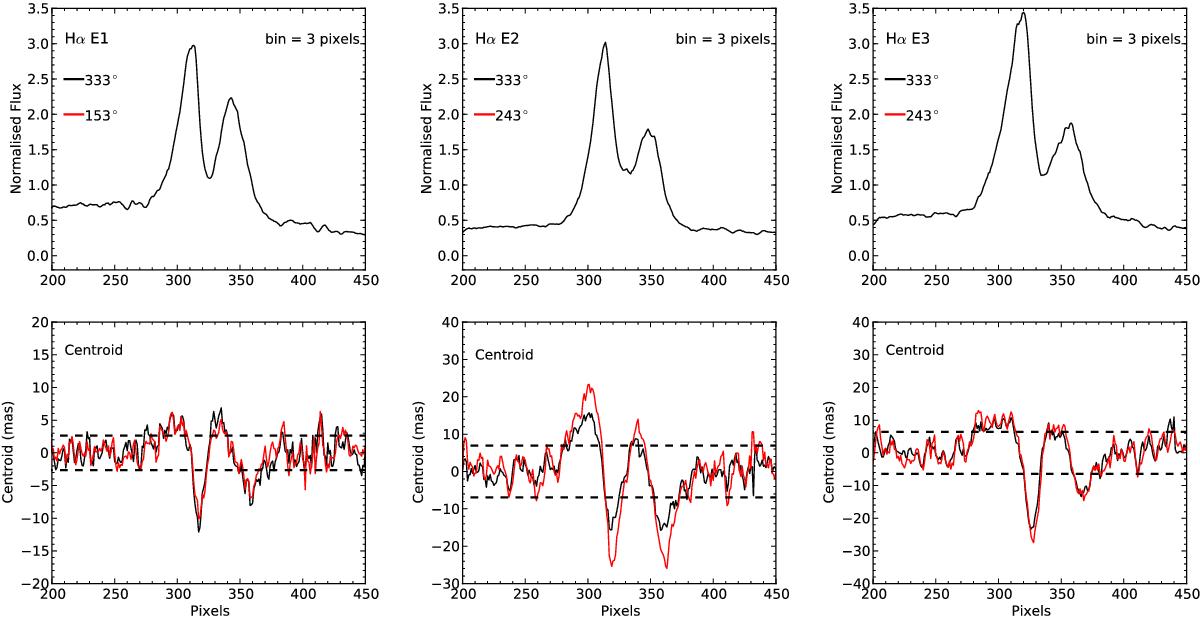
Spectro-astrometric analysis of the Hα line in each epoch. What is shown here are the normalised intensity profiles and the position spectra. The size of the bin used in the analysis is given. The black line is the data along the estimated companion PA and the red line the data parallel and perpendicular to this PA. The dashed horizontal lines are the 1σ uncertainty.
Current usage metrics show cumulative count of Article Views (full-text article views including HTML views, PDF and ePub downloads, according to the available data) and Abstracts Views on Vision4Press platform.
Data correspond to usage on the plateform after 2015. The current usage metrics is available 48-96 hours after online publication and is updated daily on week days.
Initial download of the metrics may take a while.