Fig. 2
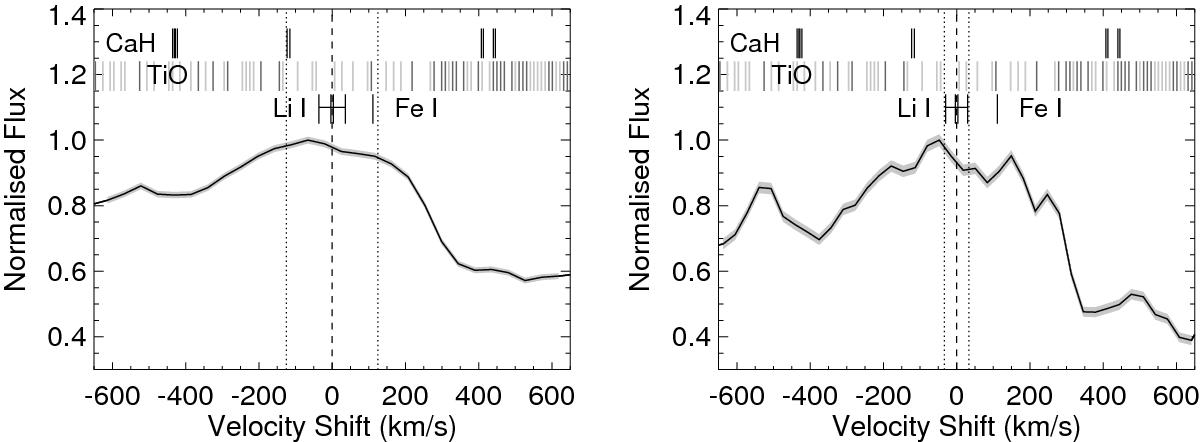
Zoom-in on the combined spectra (black line) for SDSS1256 (left) and 2MASS1626 (right) around the Li I line. The grey bands indicate the formal spectral uncertainties while the horizontal error bar indicates the 3σ radial velocity uncertainties. Dotted lines indicate the velocity resolution of the instruments used. Overplotted at the top are marked the main features of CaH, Li, Fe, and TiO. We note that TiO is blanketing the entire region with cross-sections of various strengths from 5 × 10-17, 1 × 10-16, 5 × 10-16 cm2/molecules shown in three shades of grey (light to dark).
Current usage metrics show cumulative count of Article Views (full-text article views including HTML views, PDF and ePub downloads, according to the available data) and Abstracts Views on Vision4Press platform.
Data correspond to usage on the plateform after 2015. The current usage metrics is available 48-96 hours after online publication and is updated daily on week days.
Initial download of the metrics may take a while.