Fig. 9
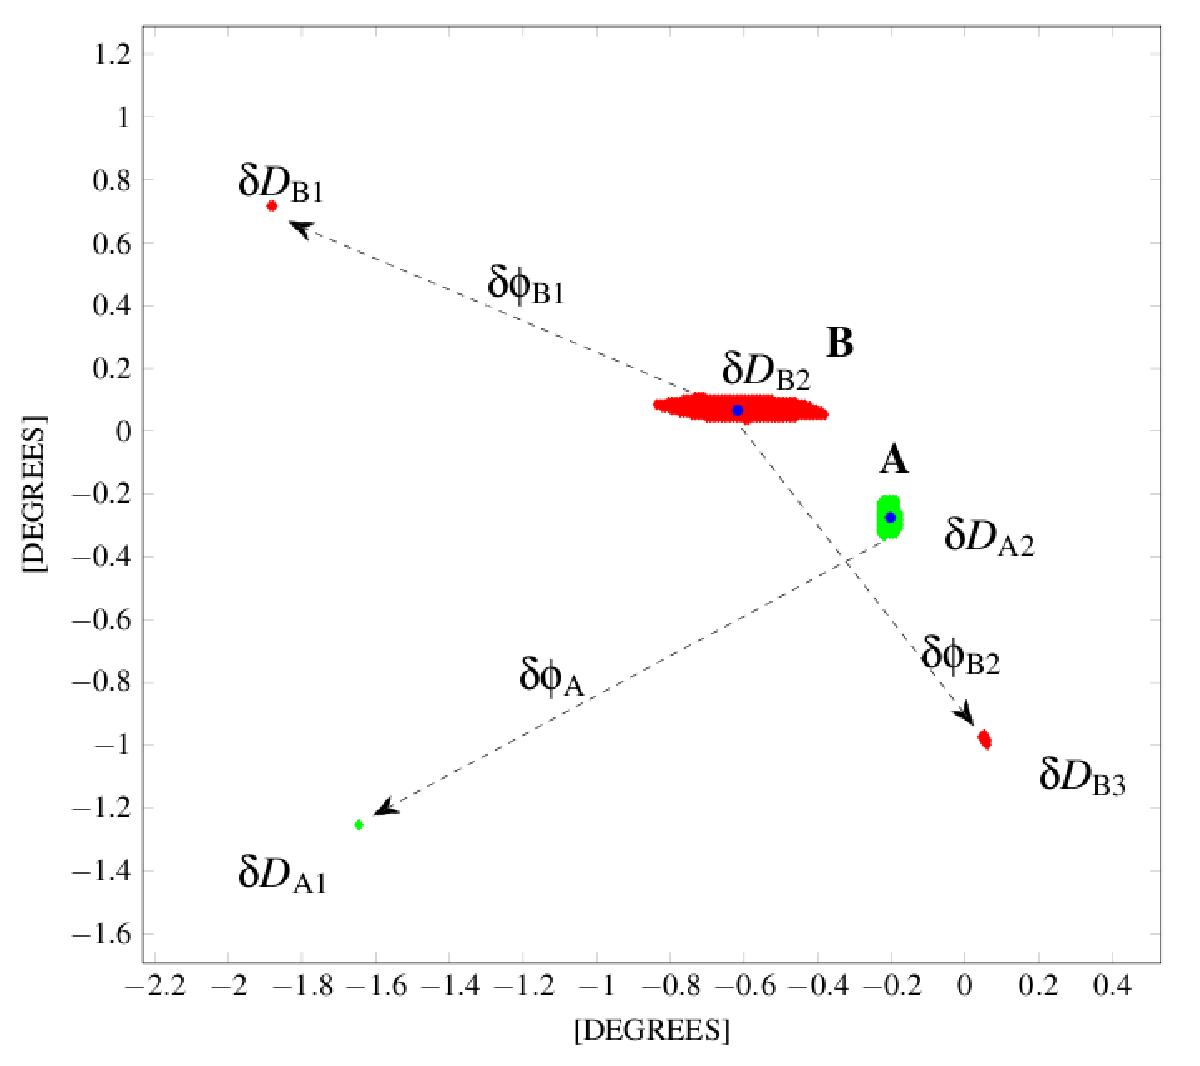
Schematic representation of locations m, the total area D and the angular distance δφ from the true source position, marked with blue dot. The green patches (m = 2) represent the two estimated locations for source A. Red patches (m = 3) represent the three estimated locations for source B. While there may be a significant angular distance between the estimated locations, the areas to search at these locations may be quite small.
Current usage metrics show cumulative count of Article Views (full-text article views including HTML views, PDF and ePub downloads, according to the available data) and Abstracts Views on Vision4Press platform.
Data correspond to usage on the plateform after 2015. The current usage metrics is available 48-96 hours after online publication and is updated daily on week days.
Initial download of the metrics may take a while.