Fig. 8
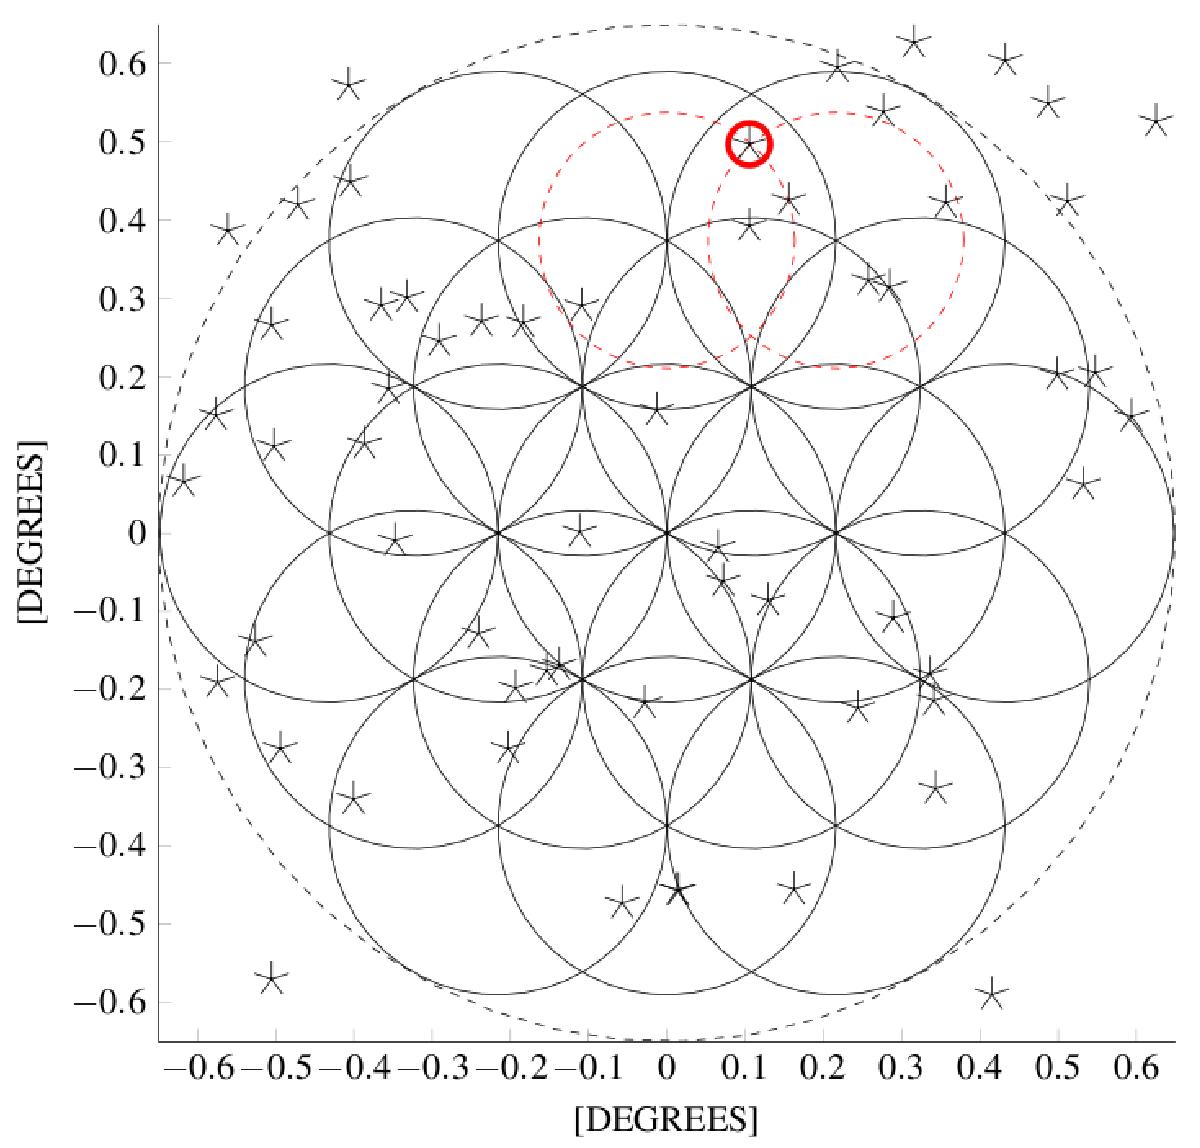
A schematic of Nyquist sampled LOFAR TABs which illustrates the general layout assumed in all simulations. Black circles represent a 3-dB contour of a TAB at the lower frequency νL in the observing band. The dashed circle represents the TAB test area and stars depict positions of randomly generated sources. Two red circles represent a 3-dB contour of a TAB at the higher frequency νH of the observing band.
Current usage metrics show cumulative count of Article Views (full-text article views including HTML views, PDF and ePub downloads, according to the available data) and Abstracts Views on Vision4Press platform.
Data correspond to usage on the plateform after 2015. The current usage metrics is available 48-96 hours after online publication and is updated daily on week days.
Initial download of the metrics may take a while.