Free Access
Fig. 6
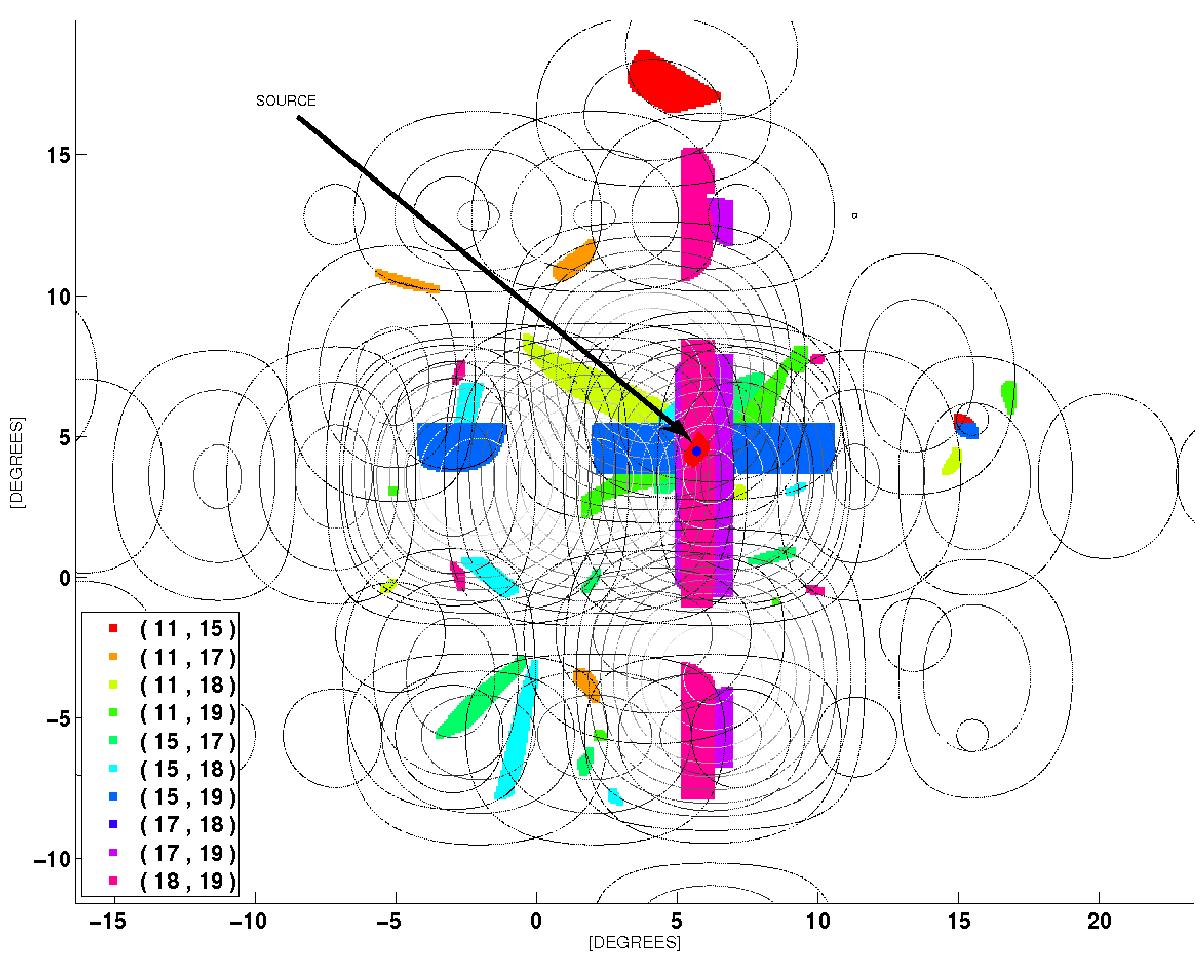
Illustration of a detection made with five TABs that Nyquist sample the FoV resulting
in ![]() pair combinations. Each colour depicts
overlapping regions of (s1/
s2)(i,j) and
(a2 −
a1)(i,j) from each
(i,j)
TAB pair.
pair combinations. Each colour depicts
overlapping regions of (s1/
s2)(i,j) and
(a2 −
a1)(i,j) from each
(i,j)
TAB pair.
Current usage metrics show cumulative count of Article Views (full-text article views including HTML views, PDF and ePub downloads, according to the available data) and Abstracts Views on Vision4Press platform.
Data correspond to usage on the plateform after 2015. The current usage metrics is available 48-96 hours after online publication and is updated daily on week days.
Initial download of the metrics may take a while.