Fig. 4
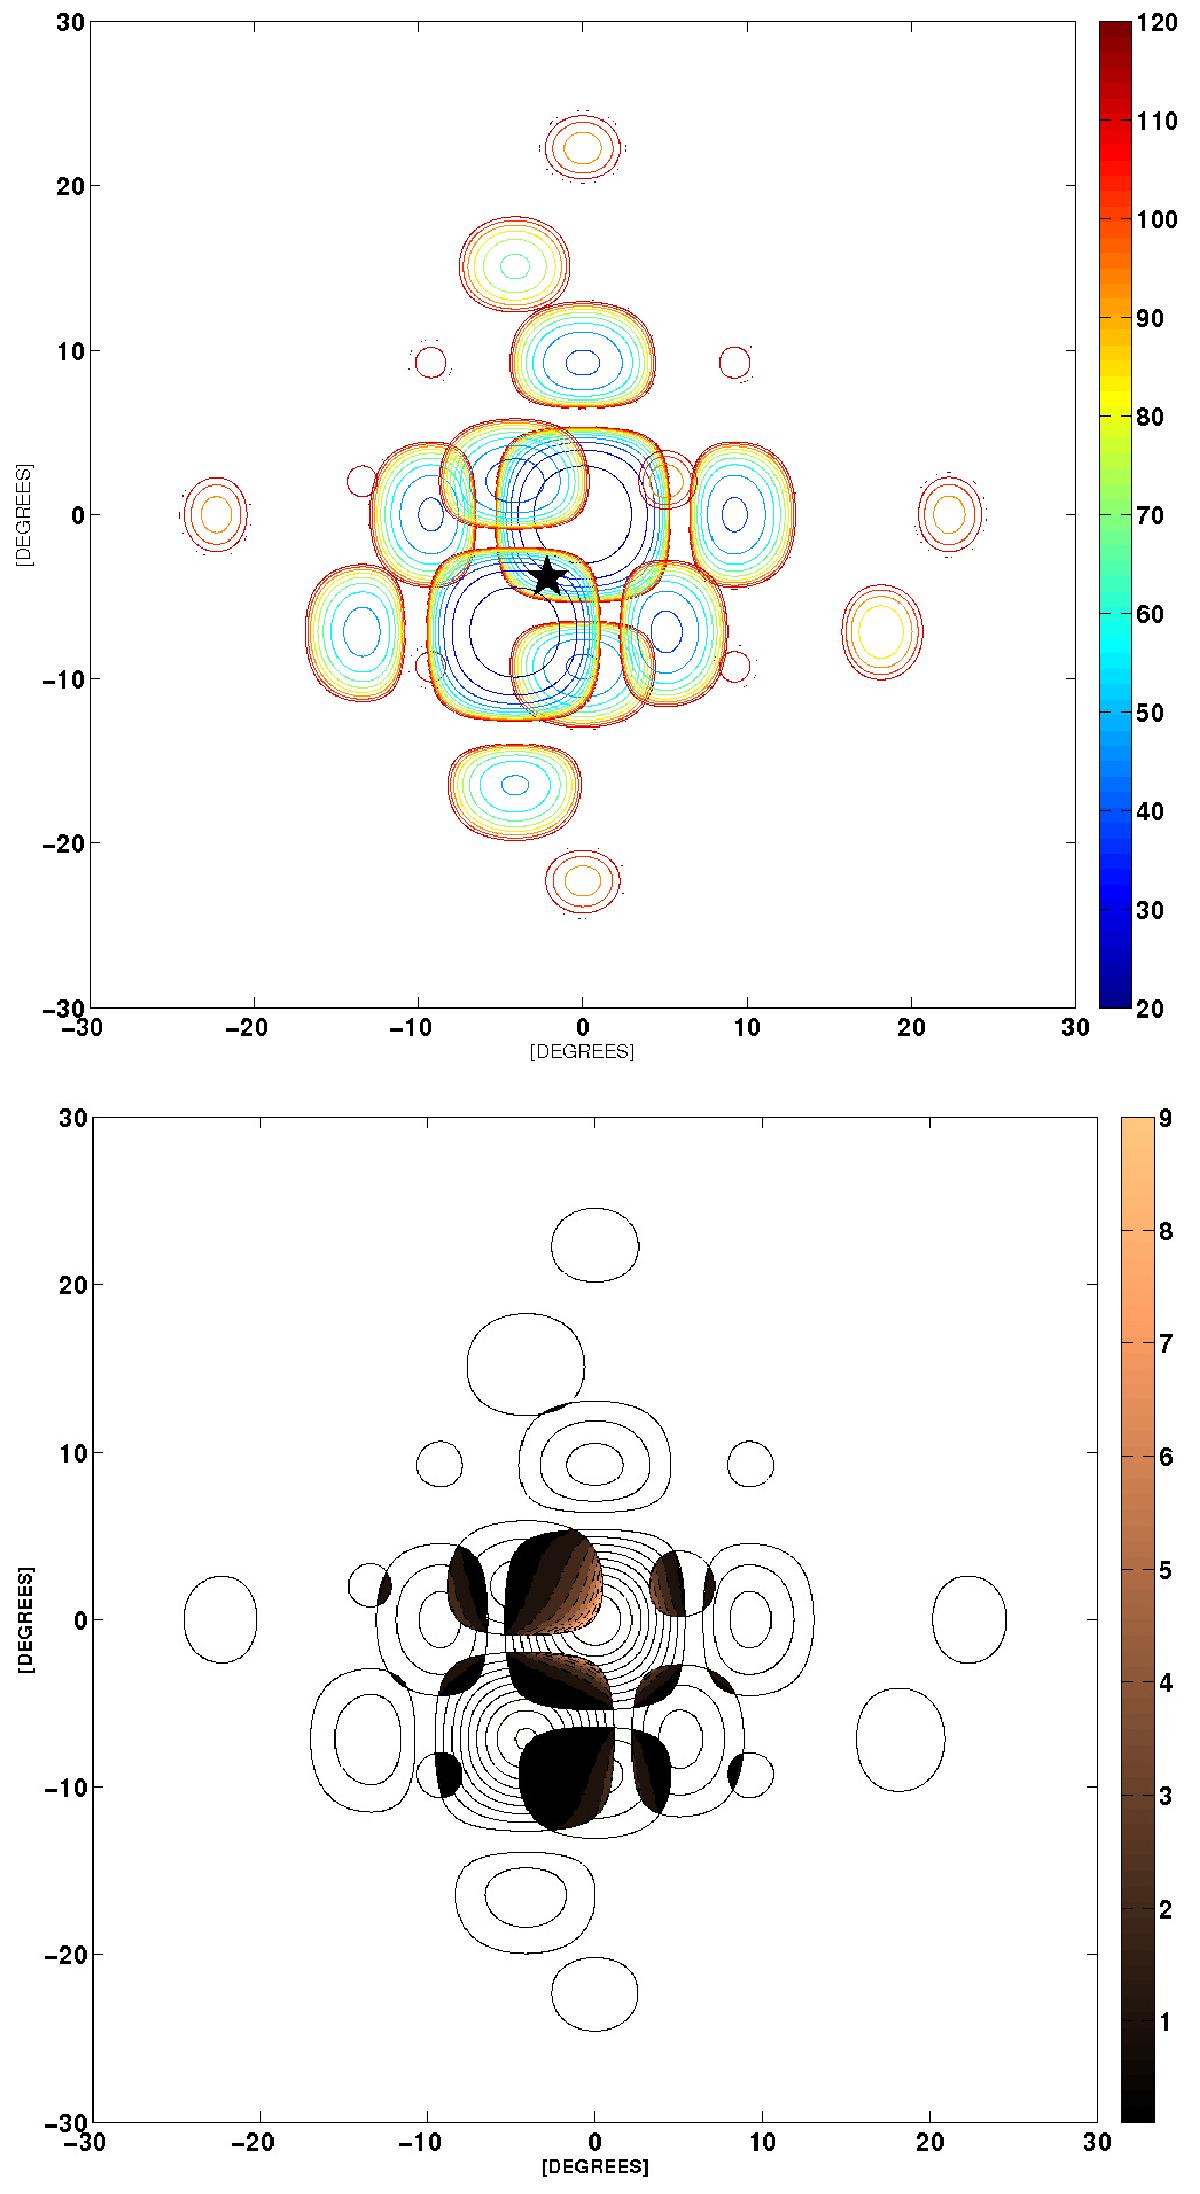
Top: contour plot of the sensitivity maps of two overlapping TABs and their sidelobes of the MUST array in units of Jy. The black star depicts location of a source for a simple example in Sect. 3.1. Bottom: the flux density ratio map with TAB contours plotted with dashed lines. The flux ratio values are limited to the range [ 0.1,10 ] for clarity.
Current usage metrics show cumulative count of Article Views (full-text article views including HTML views, PDF and ePub downloads, according to the available data) and Abstracts Views on Vision4Press platform.
Data correspond to usage on the plateform after 2015. The current usage metrics is available 48-96 hours after online publication and is updated daily on week days.
Initial download of the metrics may take a while.