Fig. 12
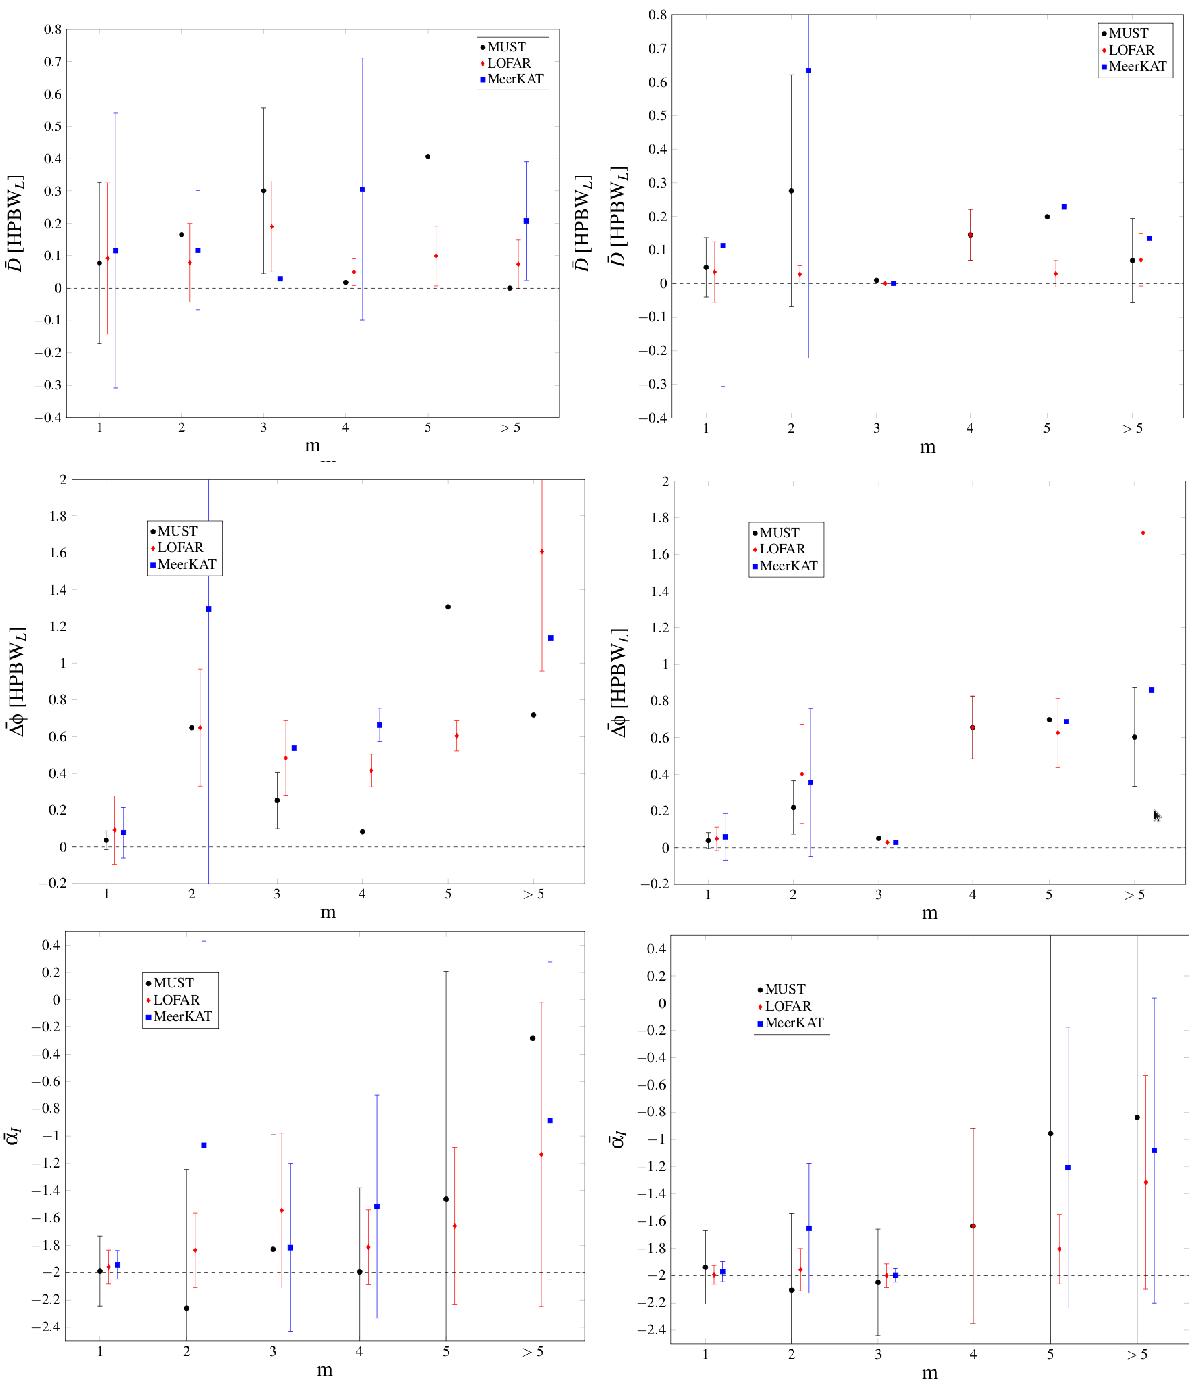
Summary of Table 3 for the Nyquist sampled
(left) and oversampled (right) method.
Top: mean total area ![]() covered by the estimated positions
normalised to HPBW area in deg2, where the error corresponds to one standard
deviation from that mean for each m. Middle:
mean angular distance
covered by the estimated positions
normalised to HPBW area in deg2, where the error corresponds to one standard
deviation from that mean for each m. Middle:
mean angular distance ![]() between the estimated and the true
source position. Bottom: mean estimated intrinsic spectral index
between the estimated and the true
source position. Bottom: mean estimated intrinsic spectral index
![]() for combined sources in each
m.
for combined sources in each
m.
Current usage metrics show cumulative count of Article Views (full-text article views including HTML views, PDF and ePub downloads, according to the available data) and Abstracts Views on Vision4Press platform.
Data correspond to usage on the plateform after 2015. The current usage metrics is available 48-96 hours after online publication and is updated daily on week days.
Initial download of the metrics may take a while.