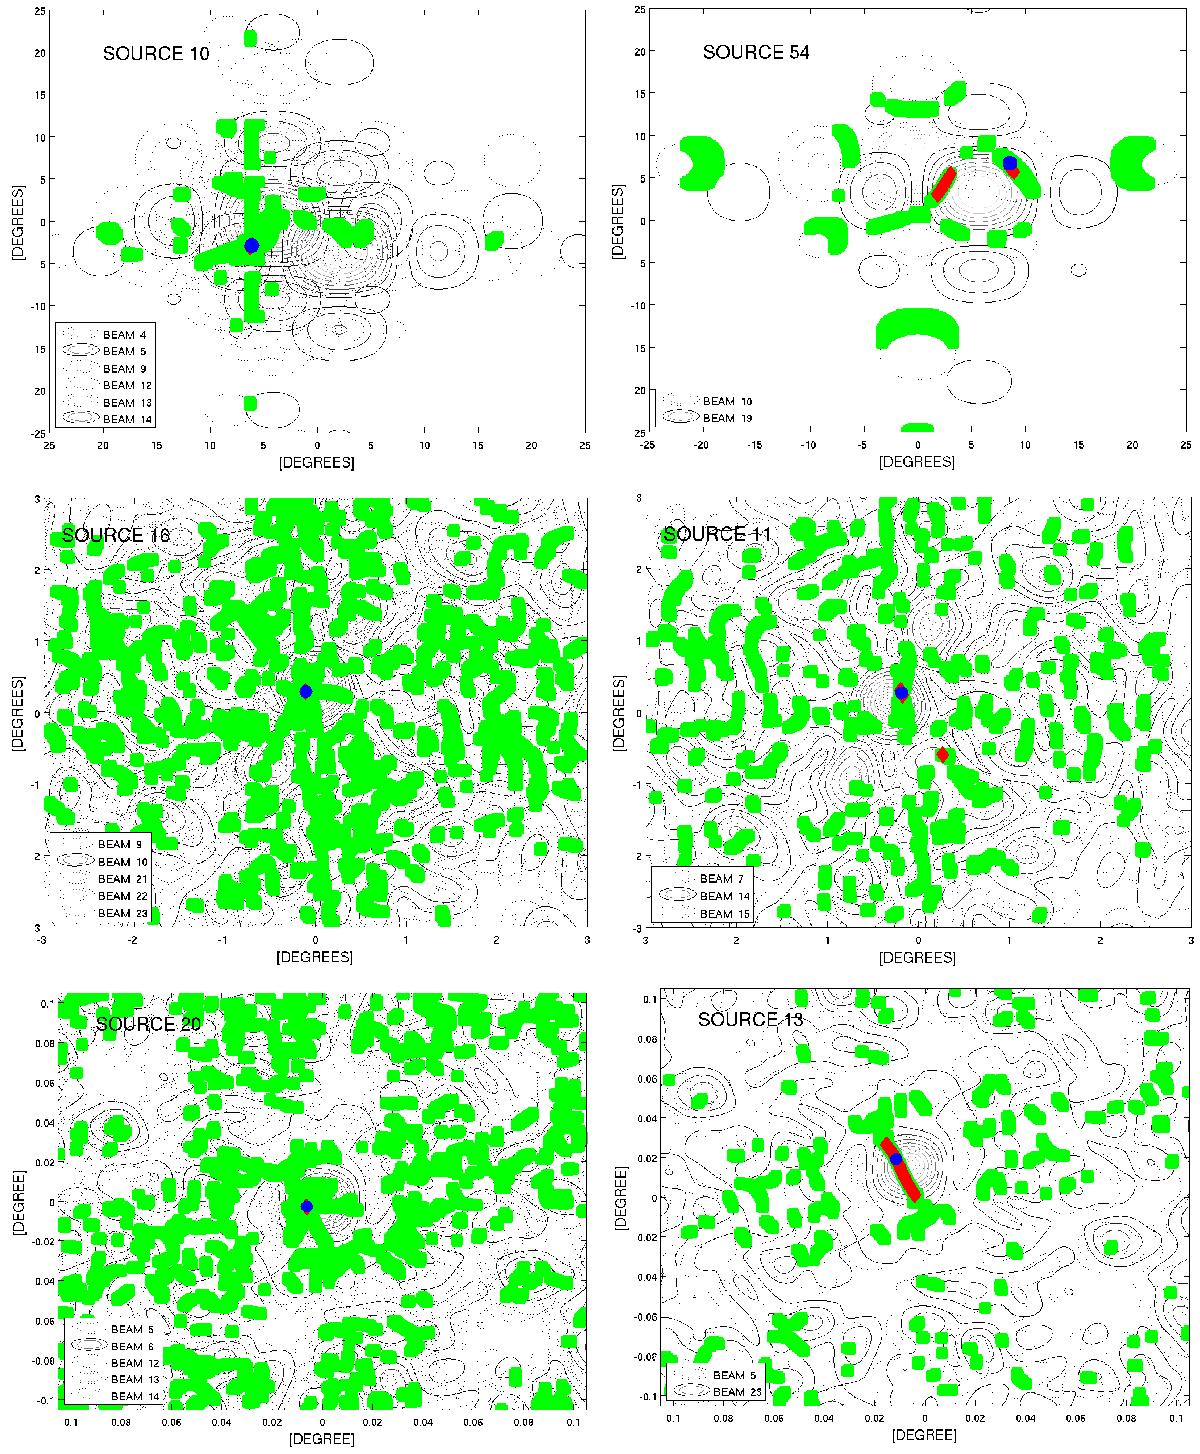
Fig. 11

Detection examples, discussed in Sect. 4.2, with low and high positional uncertainty (left and right respectively) for the MUST array (top), the LOFAR array (middle) and MeerKAT array (bottom). (Green squares) values of s1/ s2 and (a2 − a1) from each TAB. The red diamonds regions where s1/ s2 and (a2 − a1) from all TABs overlap. The blue circles the true position of a source. Red regions in all cases include the true location of the source and so is obscured in the left panels in particular.
Current usage metrics show cumulative count of Article Views (full-text article views including HTML views, PDF and ePub downloads, according to the available data) and Abstracts Views on Vision4Press platform.
Data correspond to usage on the plateform after 2015. The current usage metrics is available 48-96 hours after online publication and is updated daily on week days.
Initial download of the metrics may take a while.


