Fig. 10
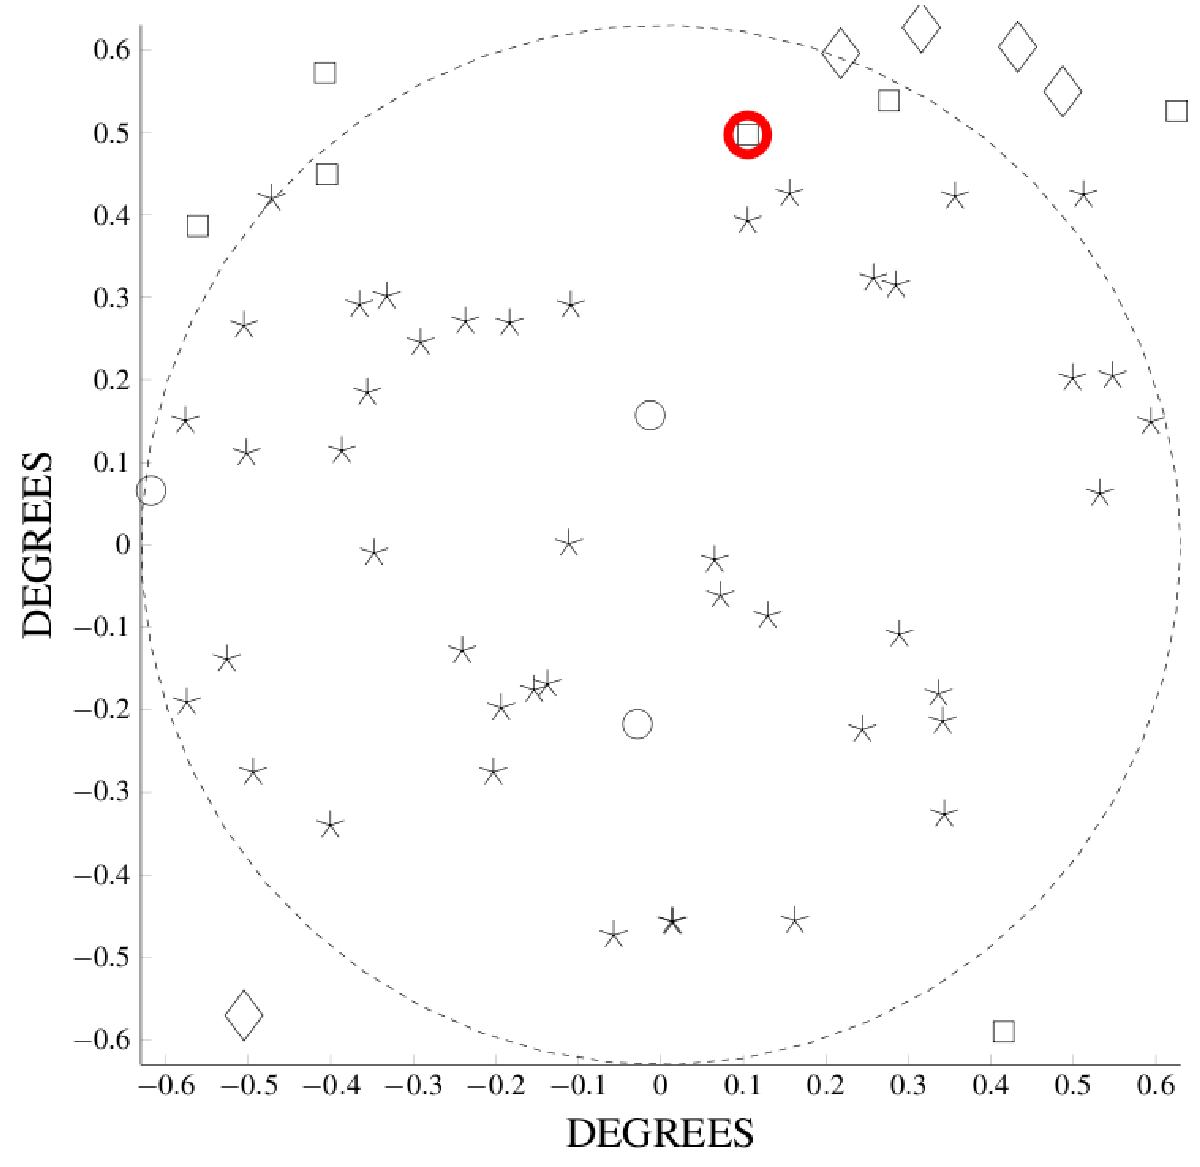
Graphical representation of sources detected using different sampling methods for the LOFAR Superterp TABs. Black circle: sources detected with undersampling, Nyquist sampling and oversampling. Star: sources detected with Nyquist sampling and oversampling. Diamond: no detection with any sampling method. Square: sources detected with oversampling only.
Current usage metrics show cumulative count of Article Views (full-text article views including HTML views, PDF and ePub downloads, according to the available data) and Abstracts Views on Vision4Press platform.
Data correspond to usage on the plateform after 2015. The current usage metrics is available 48-96 hours after online publication and is updated daily on week days.
Initial download of the metrics may take a while.