Fig. 6
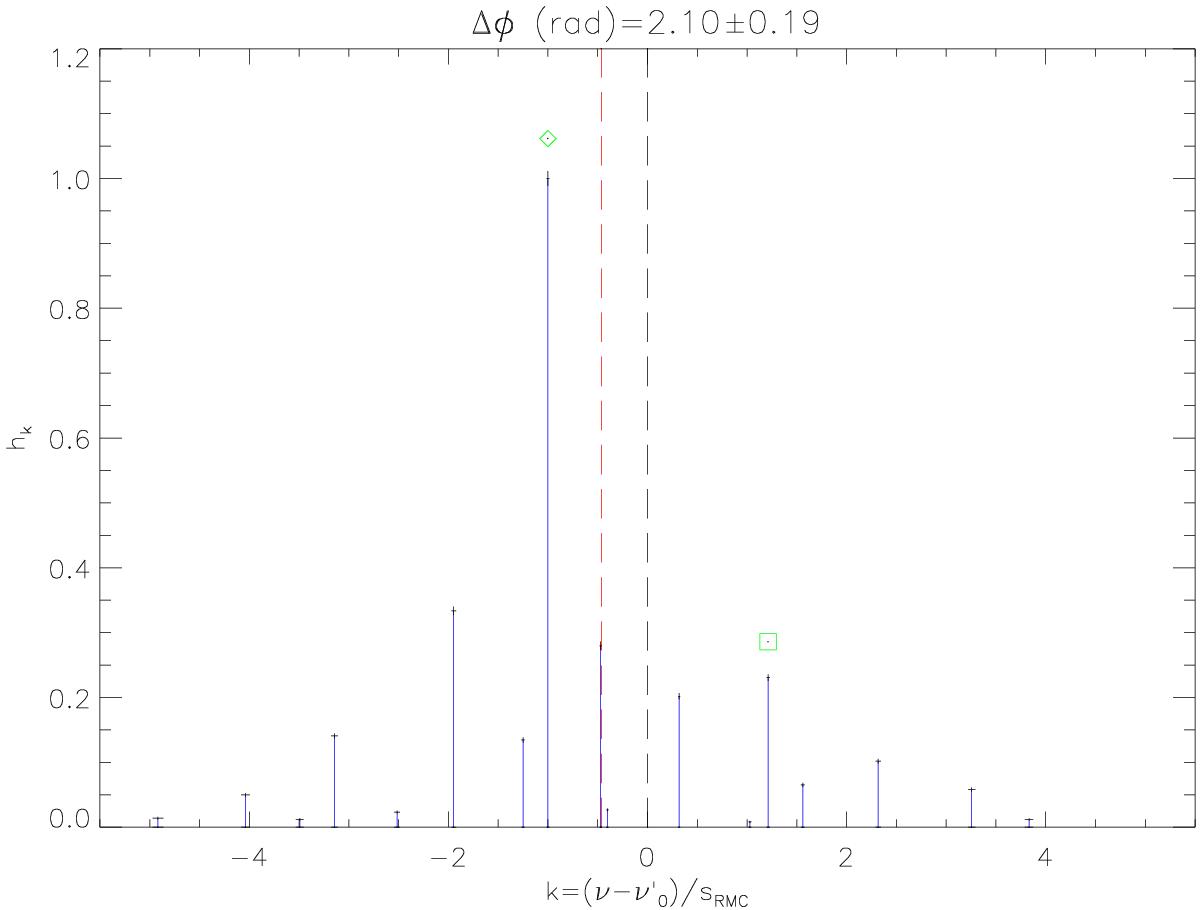
Peaks near the unstable mode f1. The abscissa represents the frequency difference from the central peak (black dashed line) in units of the splitting (sRMC). The amplitudes have been normalized to the highest first order split peak. Green diamond and square are pointing to the maximum and the minimum first order split peaks respectively. The linear frequency of the mode (red dashed line) is lower than the central peak (see text).
Current usage metrics show cumulative count of Article Views (full-text article views including HTML views, PDF and ePub downloads, according to the available data) and Abstracts Views on Vision4Press platform.
Data correspond to usage on the plateform after 2015. The current usage metrics is available 48-96 hours after online publication and is updated daily on week days.
Initial download of the metrics may take a while.