Fig. 10
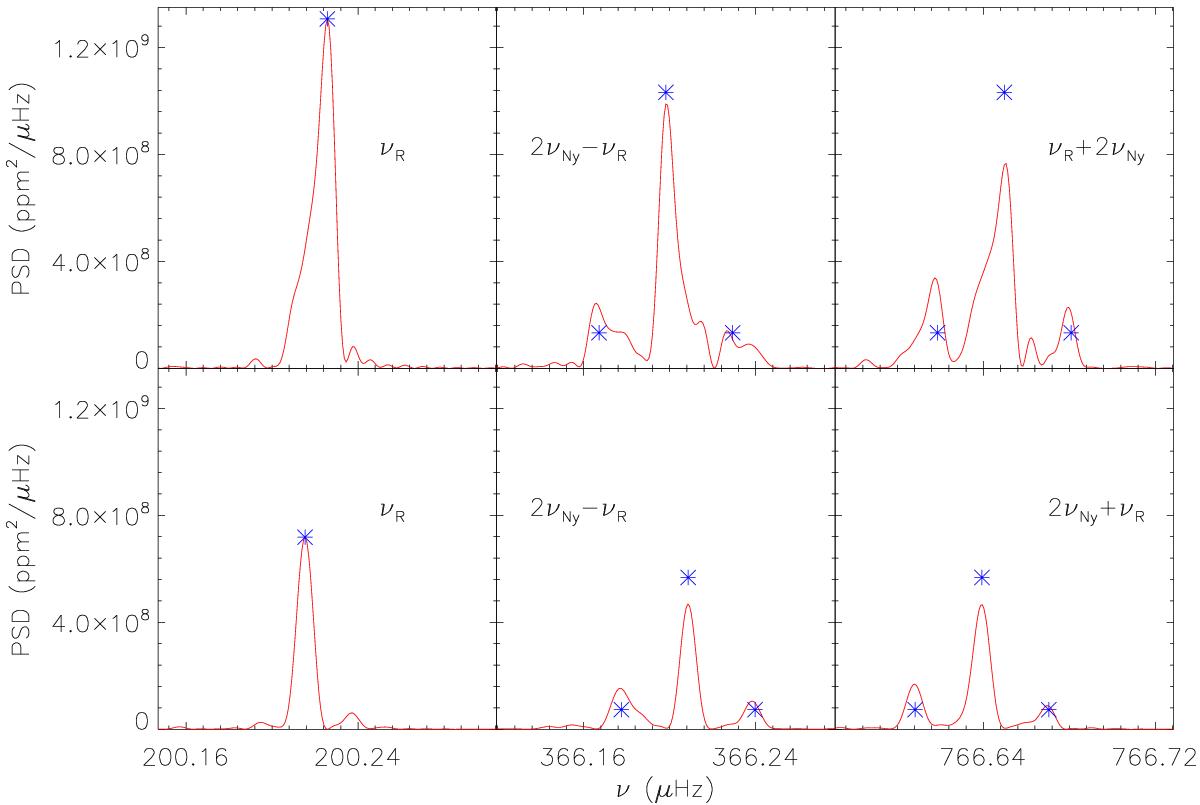
Upper panel from left to right: power spectral density of the f1 mode in the infra- and two consecutive superNyquist regimes. The same for lower panel after subtracting the central peak, which allows us to observe f6. The theoretical maximum PSD of the peaks is marked (blue asterisks) assuming that the infraNyquist peak is real (see text).
Current usage metrics show cumulative count of Article Views (full-text article views including HTML views, PDF and ePub downloads, according to the available data) and Abstracts Views on Vision4Press platform.
Data correspond to usage on the plateform after 2015. The current usage metrics is available 48-96 hours after online publication and is updated daily on week days.
Initial download of the metrics may take a while.