Fig. 4
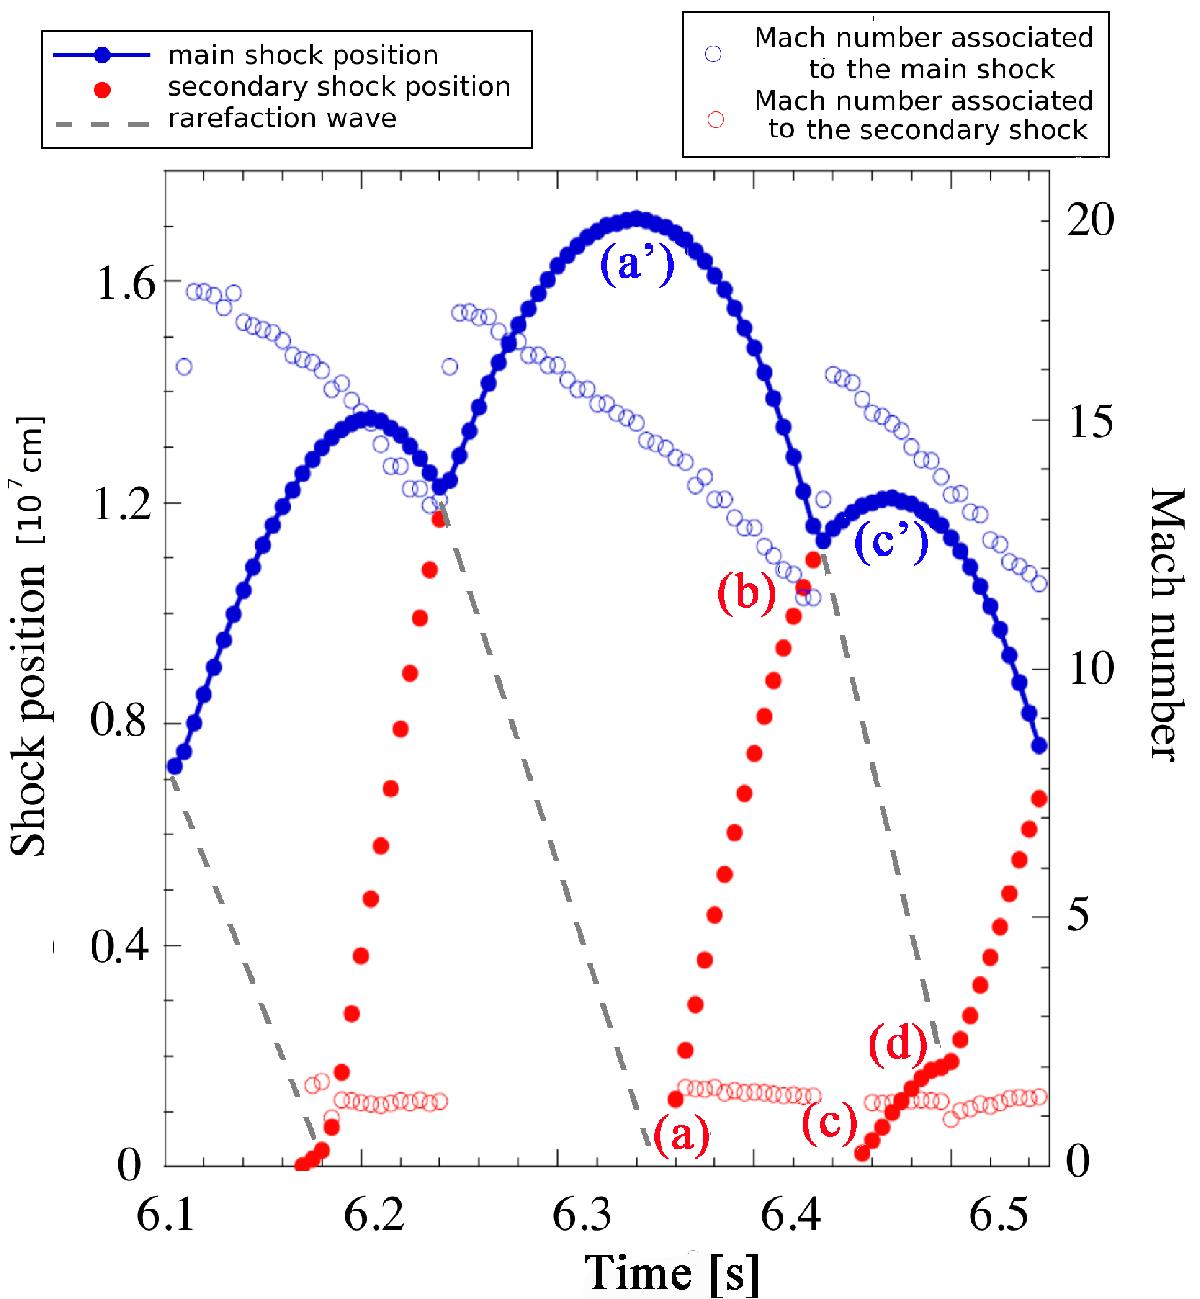
Evolution with time of the position of the main shock (blue filled points), the secondary shock (red filled points) and the rarefaction wave (grey dashed line) in the same condition as in Fig. 3. The Mach number value for the two shocks are also shown by the open symbols. Different critical times through the oscillation are labelled by letters and discussed in the text.
Current usage metrics show cumulative count of Article Views (full-text article views including HTML views, PDF and ePub downloads, according to the available data) and Abstracts Views on Vision4Press platform.
Data correspond to usage on the plateform after 2015. The current usage metrics is available 48-96 hours after online publication and is updated daily on week days.
Initial download of the metrics may take a while.