Fig. 9
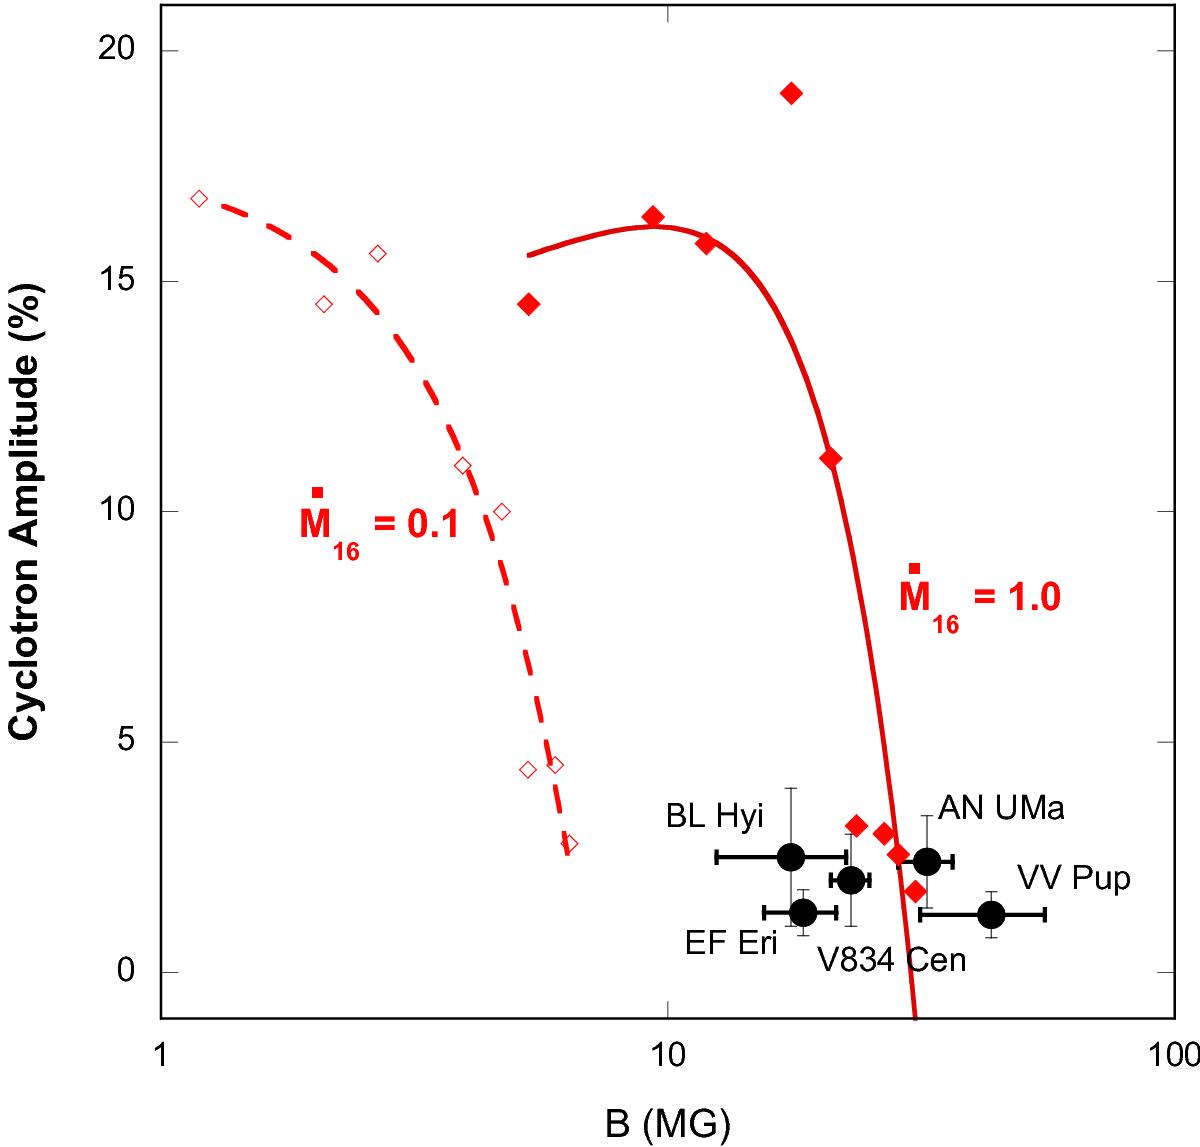
Measured optical oscillation amplitudes detected among polars as a function of magnetic field strength. Also displayed are the QPO amplitudes predicted by numerical simulations of the shock instability (see text) onto a 0.8 M⊙ WD for different values of the accretion rate (Ṁ16 = 1.0 red line curve, Ṁ16 = 0.1 red dotted curve) and assuming a column cross-section of 1014 cm2.
Current usage metrics show cumulative count of Article Views (full-text article views including HTML views, PDF and ePub downloads, according to the available data) and Abstracts Views on Vision4Press platform.
Data correspond to usage on the plateform after 2015. The current usage metrics is available 48-96 hours after online publication and is updated daily on week days.
Initial download of the metrics may take a while.