Fig. 6
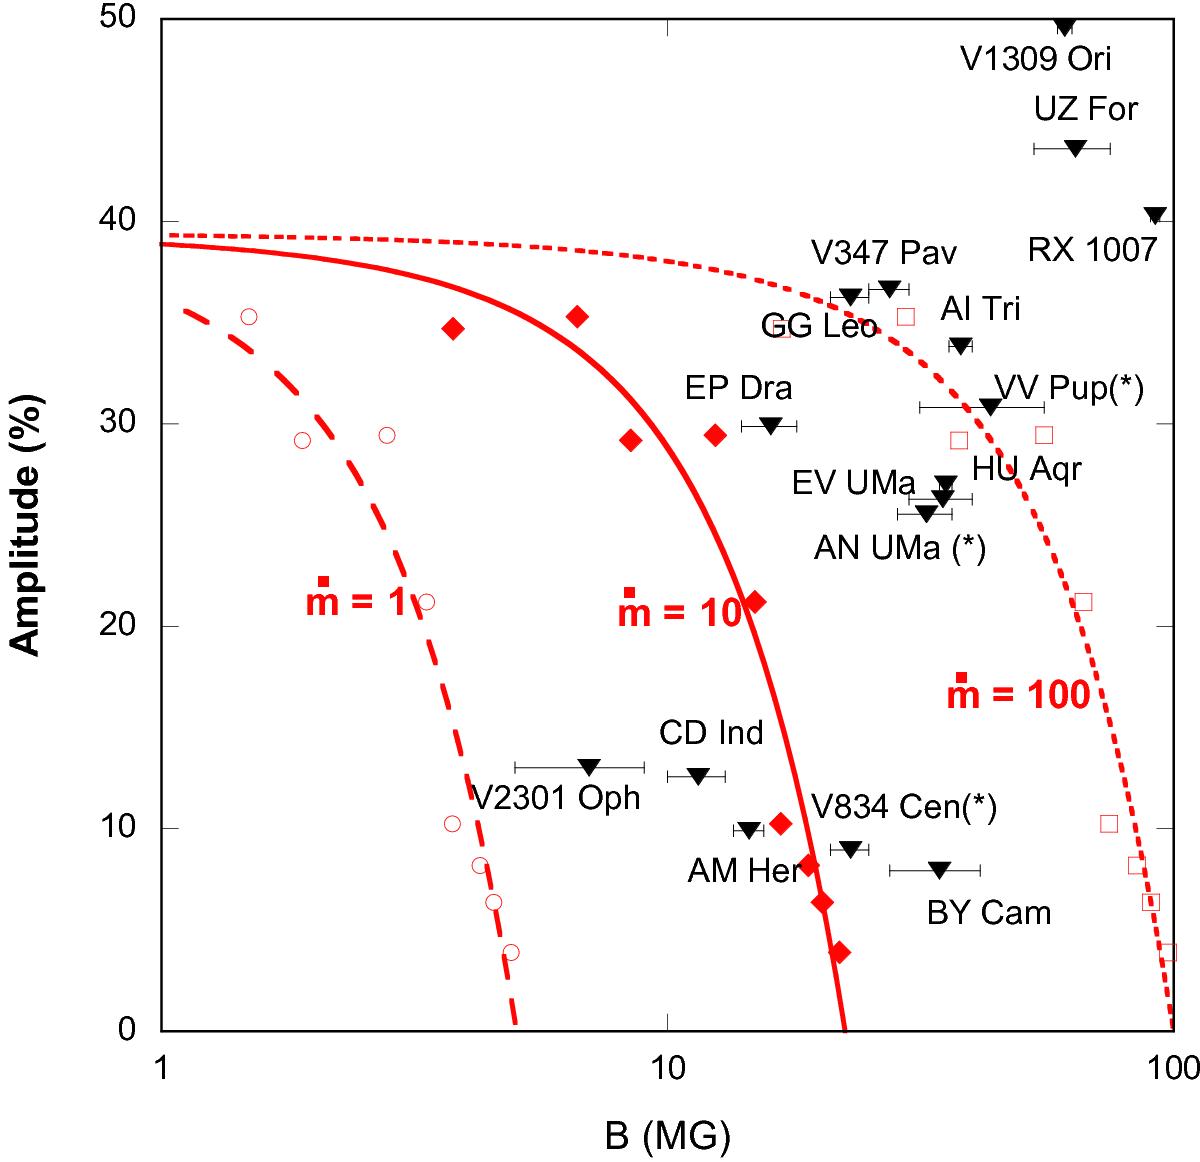
Upper limits on polar (0.1–5 Hz) oscillation amplitudes in the X-ray (0.5–10 keV) flux as a function of magnetic field strength. Only sources with upper limits (<50%) are shown. Sources with known optical QPOs are denoted by an asterisk. Also displayed are the QPO amplitudes predicted by representative numerical simulations of the shock instability (shown by symbols). Curves are polynomial fits through the individual measurements and are shown for a typical WD mass of 0.8 M⊙, a column cross-section of 1014 cm2 and for different values of the specific accretion rate (dashed curve ṁ = 1.0, full curve ṁ = 10 and dotted curve ṁ = 100 g cm-2 s-1).
Current usage metrics show cumulative count of Article Views (full-text article views including HTML views, PDF and ePub downloads, according to the available data) and Abstracts Views on Vision4Press platform.
Data correspond to usage on the plateform after 2015. The current usage metrics is available 48-96 hours after online publication and is updated daily on week days.
Initial download of the metrics may take a while.