Fig. 5
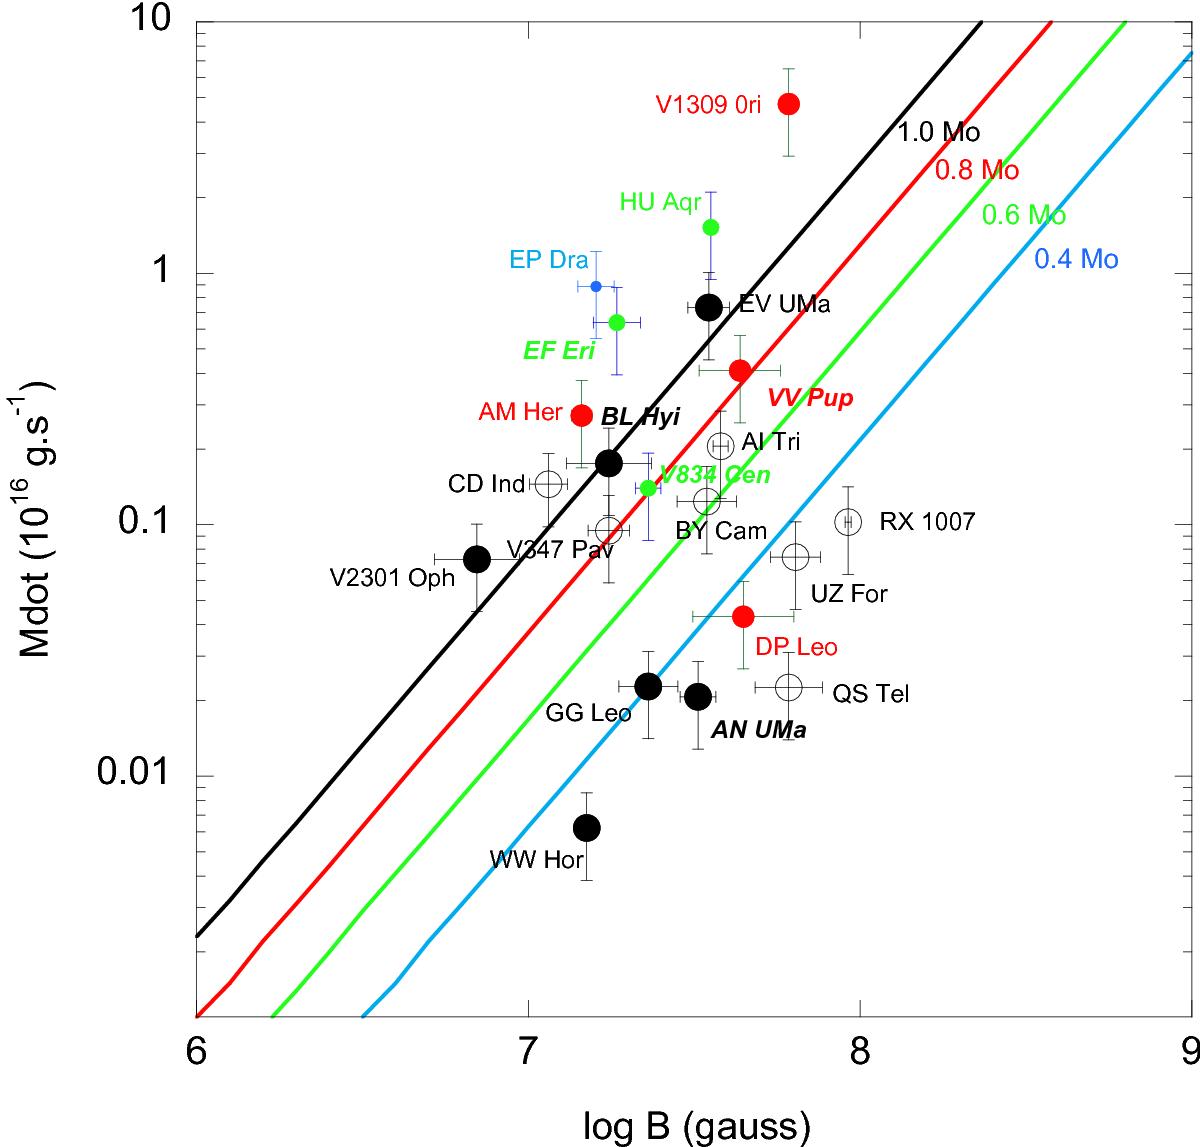
(B − Ṁ) diagram for the polars with values from Table 2. The sources are shown by filled symbols with increasing sizes and colours corresponding to their mass in the range 0.3–0.5 (blue), 0.5–0.7 (green), 0.7–0.9 (red), and 0.9–1.2 M⊙ (black). Sources with no mass determination are shown with open symbols and assumed at 1 M⊙. The 5 polars with known optical QPOs are shown in italics. The lines mark the limit of the QPO regime corresponding to ϵs = 1 (see text), assuming a representative column cross-section of 1014 cm2 and for different white dwarf mass values shown by labels and with the above colour convention. QPOs are expected above the associated line.
Current usage metrics show cumulative count of Article Views (full-text article views including HTML views, PDF and ePub downloads, according to the available data) and Abstracts Views on Vision4Press platform.
Data correspond to usage on the plateform after 2015. The current usage metrics is available 48-96 hours after online publication and is updated daily on week days.
Initial download of the metrics may take a while.