Fig. 9
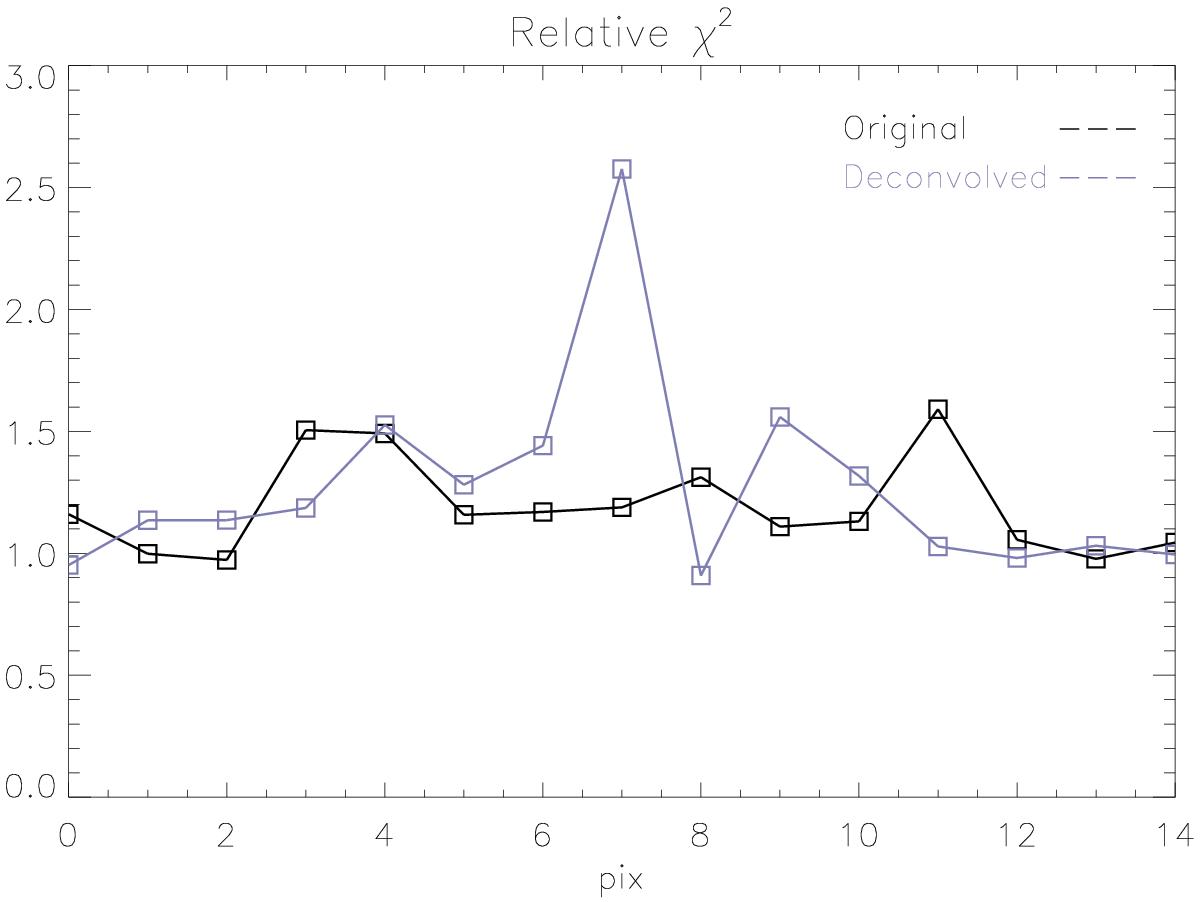
Ratio between the χ2 values obtained from the second solution, with microturbulence, over the χ2 values of the first solution, without microturbulence. Black designates this ratio obtained from the inversion of the original profiles, while gray depicts the ratio between both configurations when we inverted the deconvolved profiles. These Stokes profiles correspond to the pixels marked with the vertical line in Fig. 5.
Current usage metrics show cumulative count of Article Views (full-text article views including HTML views, PDF and ePub downloads, according to the available data) and Abstracts Views on Vision4Press platform.
Data correspond to usage on the plateform after 2015. The current usage metrics is available 48-96 hours after online publication and is updated daily on week days.
Initial download of the metrics may take a while.