Fig. 6
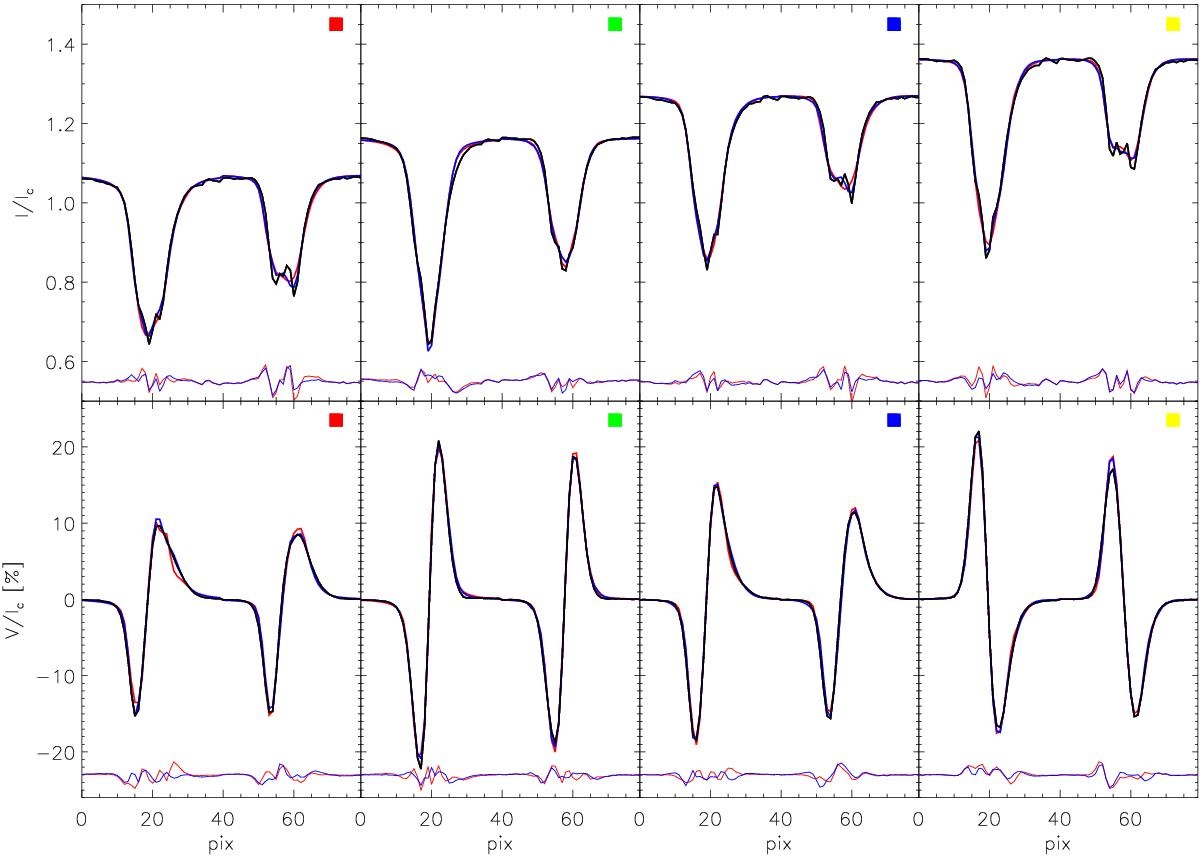
Results from the inversion of the deconvolved Stokes profiles presented in Fig. 4 (see the red profiles). We plot the Stokes I profiles in the first row and the Stokes V profiles in the second row. We omit the linear polarization profiles because their signals are always below the noise level. We plot the deconvolved profiles in black, the results from the inversion using the first configuration in red, and the results from the second configuration in blue. We also show in each panel the difference between the deconvolved and the inverted profile using the same color code of the corresponding configuration, and a colored square indicating the position of the pixel on the map of Fig. 3.
Current usage metrics show cumulative count of Article Views (full-text article views including HTML views, PDF and ePub downloads, according to the available data) and Abstracts Views on Vision4Press platform.
Data correspond to usage on the plateform after 2015. The current usage metrics is available 48-96 hours after online publication and is updated daily on week days.
Initial download of the metrics may take a while.