Free Access
Fig. 3
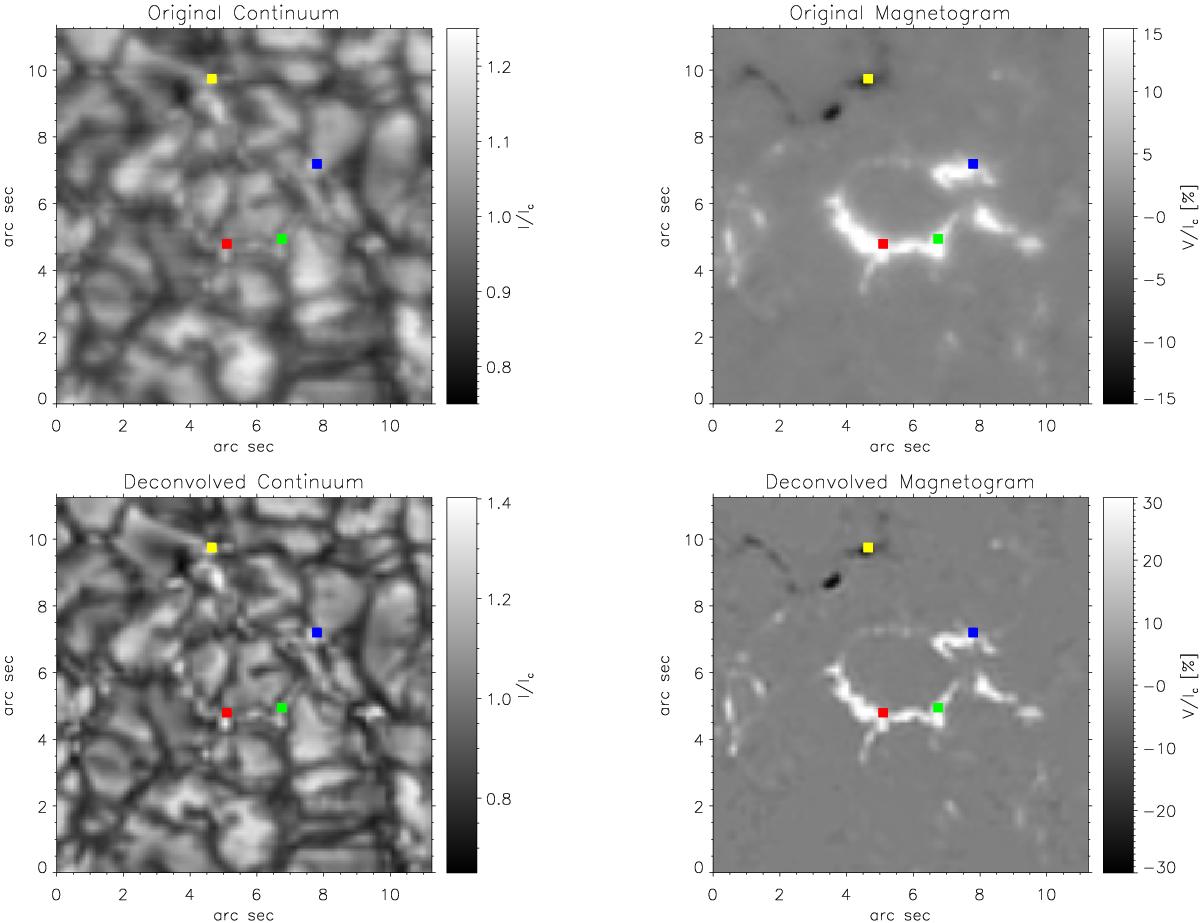
Comparison between the observed and deconvolved continuum maps, first column; and the observed and deconvolved Fe i 6302.5 Å magnetograms, second column. The observed region corresponds to the red box in Fig. 1. Finally, the four colored squares indicate the location of the Stokes profiles we examine in detail later.
Current usage metrics show cumulative count of Article Views (full-text article views including HTML views, PDF and ePub downloads, according to the available data) and Abstracts Views on Vision4Press platform.
Data correspond to usage on the plateform after 2015. The current usage metrics is available 48-96 hours after online publication and is updated daily on week days.
Initial download of the metrics may take a while.