Free Access
Fig. 1
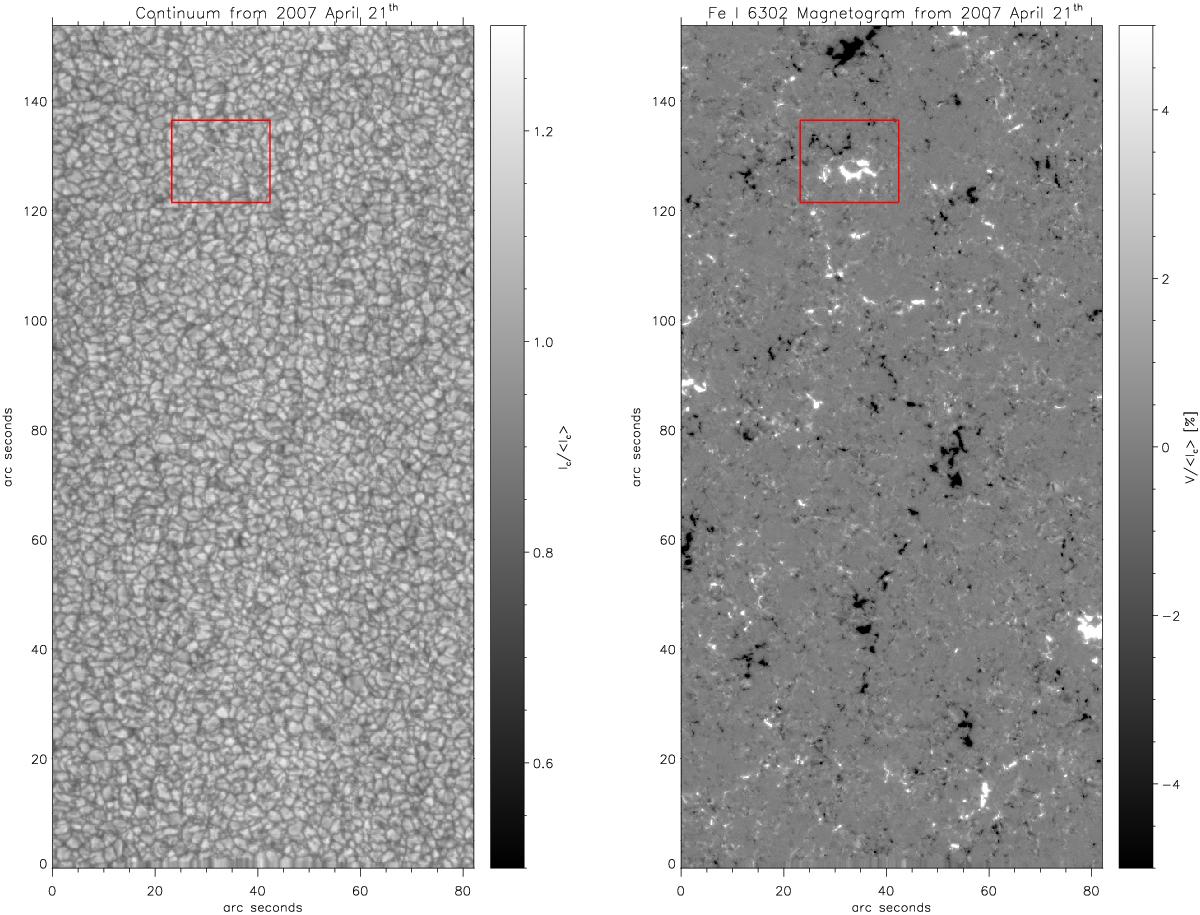
Continuum map, left, and Fe i 6302.5 Å magnetogram, right. The presence of small and not very common magnetic patches indicates that this map corresponds to a very quiet Sun region. Red square marks the magnetic element studied in detail.
Current usage metrics show cumulative count of Article Views (full-text article views including HTML views, PDF and ePub downloads, according to the available data) and Abstracts Views on Vision4Press platform.
Data correspond to usage on the plateform after 2015. The current usage metrics is available 48-96 hours after online publication and is updated daily on week days.
Initial download of the metrics may take a while.