Fig. 9
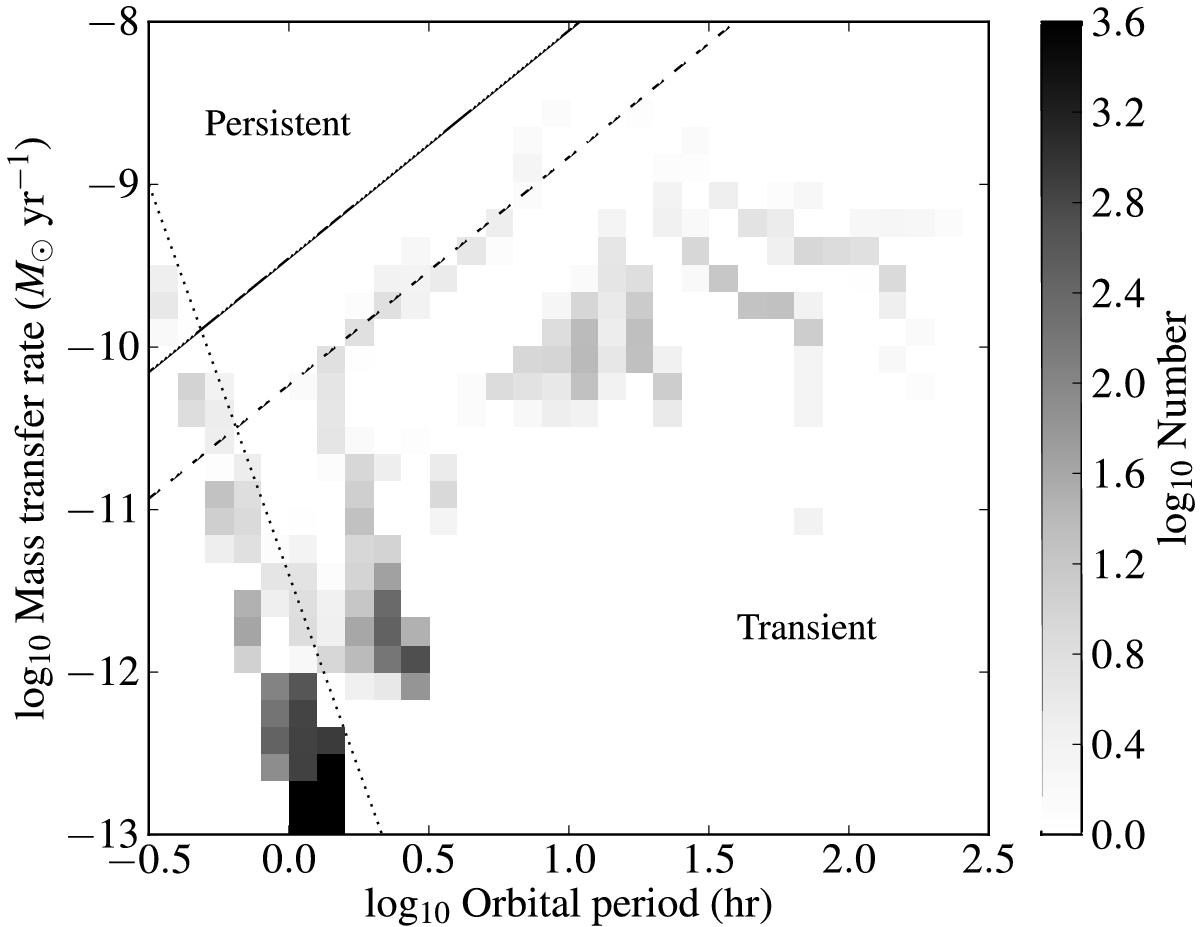
Model distribution of present-day mass transfer rate versus orbital period for all UCXBs (the vast majority of systems to the left of the dotted line) and hydrogen-rich LMXBs (virtually all systems to the right of the dotted line) in the Galactic Bulge, assuming the UCXB evolution is driven only by gravitational wave radiation, and that all systems remain semi-detached. White squares correspond to one or fewer systems. The highest density in the figure is 105 (outside the scale). The solid line shows the critical mass transfer rate for thermal-viscous disk instability, given by Eq. (2) with Ma = 1.4 M⊙ and f = 6 (helium composition), and likewise, the dashed line for f = 1 (solar composition). The star formation history width σ = 0.5 Gyr. The hydrogen-rich LMXB population in this figure is the same as in Fig. 2, but a different density scale is used. The UCXB data in this figure are taken from van Haaften et al. (2013).
Current usage metrics show cumulative count of Article Views (full-text article views including HTML views, PDF and ePub downloads, according to the available data) and Abstracts Views on Vision4Press platform.
Data correspond to usage on the plateform after 2015. The current usage metrics is available 48-96 hours after online publication and is updated daily on week days.
Initial download of the metrics may take a while.