Fig. 2
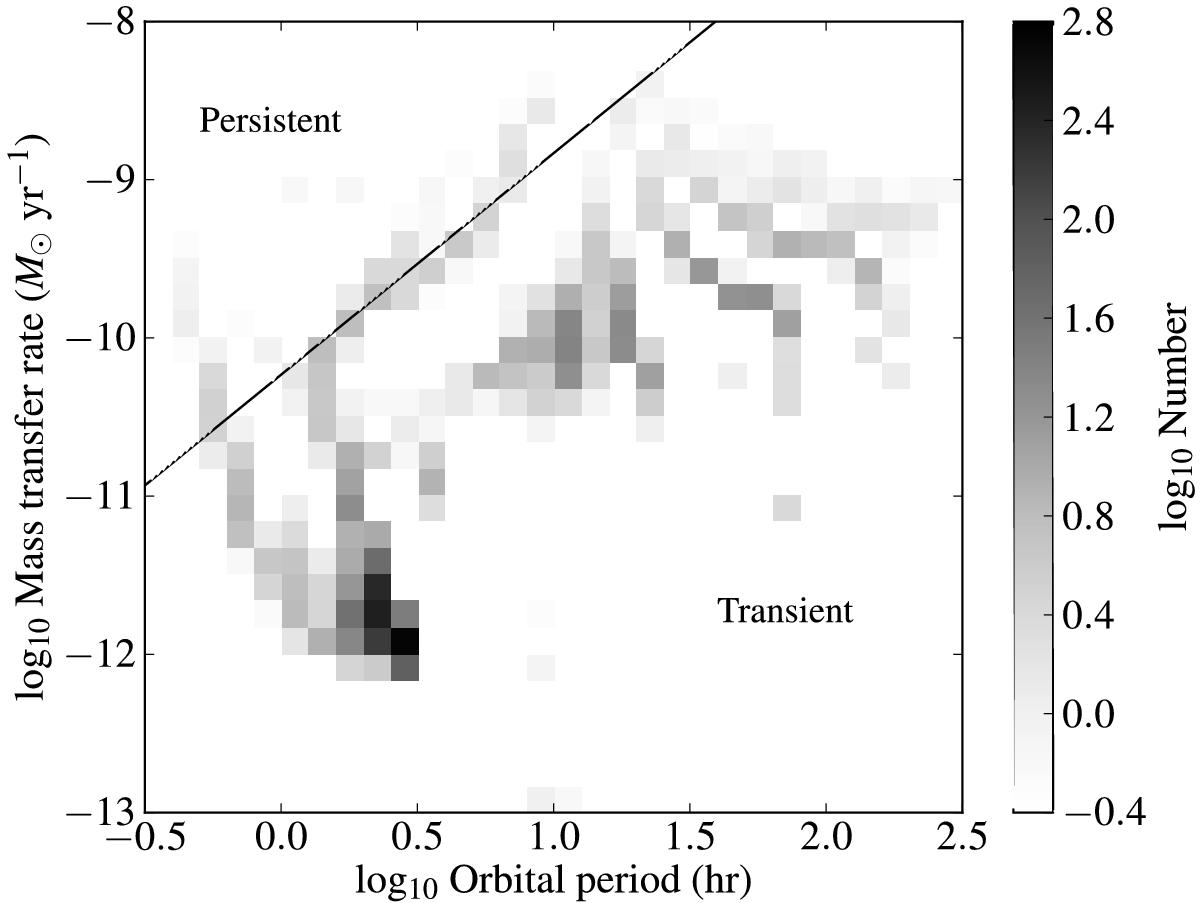
Model distribution of present-day mass transfer rate versus orbital period for hydrogen-rich LMXBs in the Galactic Bulge. White squares correspond to 0.4 or fewer LMXBs. The highest density in the figure is 102.7 ≈ 500 per pixel. The black line shows the critical mass transfer rate for thermal-viscous disk instability, given by Eq. (2) with Ma = 1.4 M⊙ and f = 1 (solar composition). The star formation history width σ = 0.5 Gyr.
Current usage metrics show cumulative count of Article Views (full-text article views including HTML views, PDF and ePub downloads, according to the available data) and Abstracts Views on Vision4Press platform.
Data correspond to usage on the plateform after 2015. The current usage metrics is available 48-96 hours after online publication and is updated daily on week days.
Initial download of the metrics may take a while.