Fig. 3
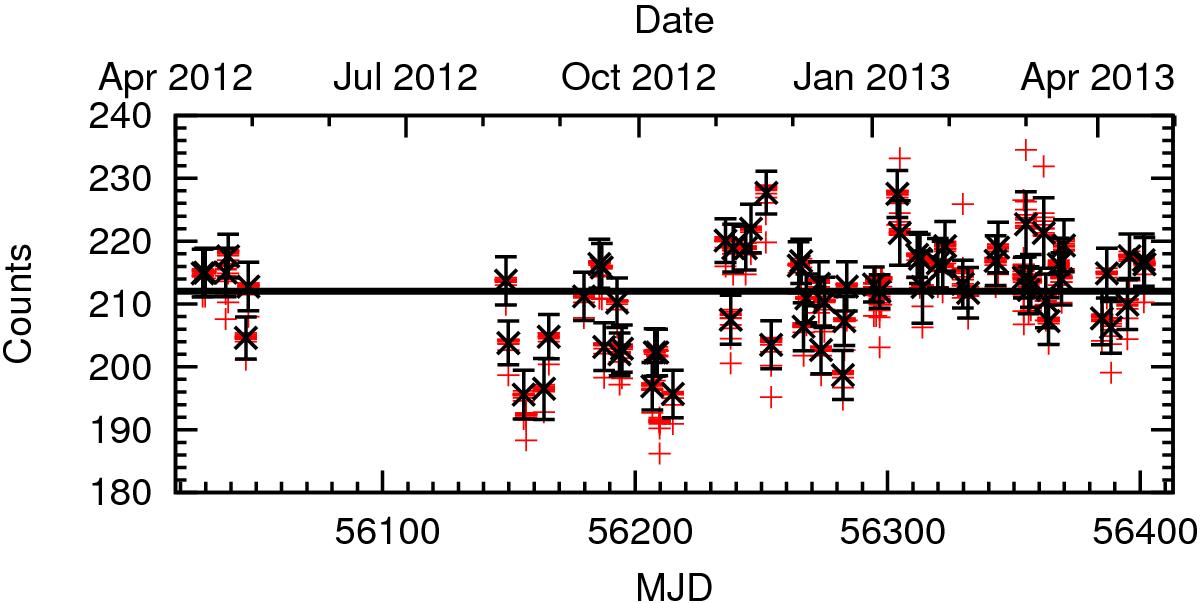
Bias level of CCD#40 over the first year of PESSTO survey operations. Red pluses are the mean count as measured over the central 200 × 200 binned pixels in each raw bias frame. Black crosses are the mean of each combined masterbias frame produced by the PESSTO pipeline from a set of raw biases, and measured over the same region. Error bars correspond to the standard deviation of the measured pixels, while the solid line is the average over the year.
Current usage metrics show cumulative count of Article Views (full-text article views including HTML views, PDF and ePub downloads, according to the available data) and Abstracts Views on Vision4Press platform.
Data correspond to usage on the plateform after 2015. The current usage metrics is available 48-96 hours after online publication and is updated daily on week days.
Initial download of the metrics may take a while.