Free Access
Fig. 2

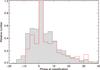
Phase of type Ia SNe at first spectrum taken with PESSTO. Results from the Palomar Transient Factory (over 2009−2012) are in grey or black (data from Maguire et al. 2014), with PESSTO and LSQ targets in red.
This figure is made of several images, please see below:
Current usage metrics show cumulative count of Article Views (full-text article views including HTML views, PDF and ePub downloads, according to the available data) and Abstracts Views on Vision4Press platform.
Data correspond to usage on the plateform after 2015. The current usage metrics is available 48-96 hours after online publication and is updated daily on week days.
Initial download of the metrics may take a while.