Free Access
Fig. 17
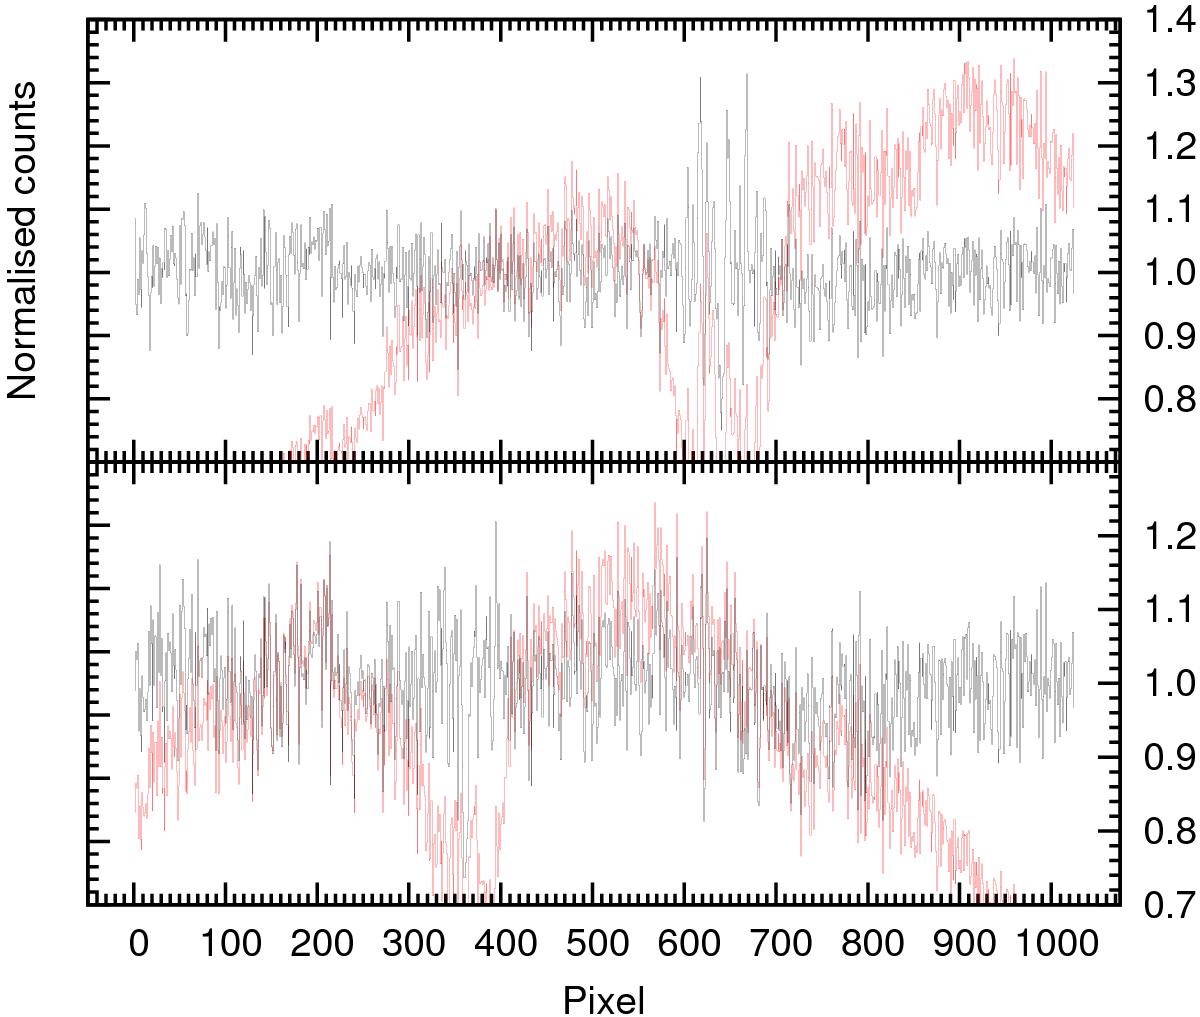
Cut across SOFI flat fields along row 512. Blue grism (lower) and red grism (upper panel) are shown, with the normalised flat field shown in black, and the raw flat field (showing the H2O absorption) in red.
Current usage metrics show cumulative count of Article Views (full-text article views including HTML views, PDF and ePub downloads, according to the available data) and Abstracts Views on Vision4Press platform.
Data correspond to usage on the plateform after 2015. The current usage metrics is available 48-96 hours after online publication and is updated daily on week days.
Initial download of the metrics may take a while.