Free Access
Fig. 15
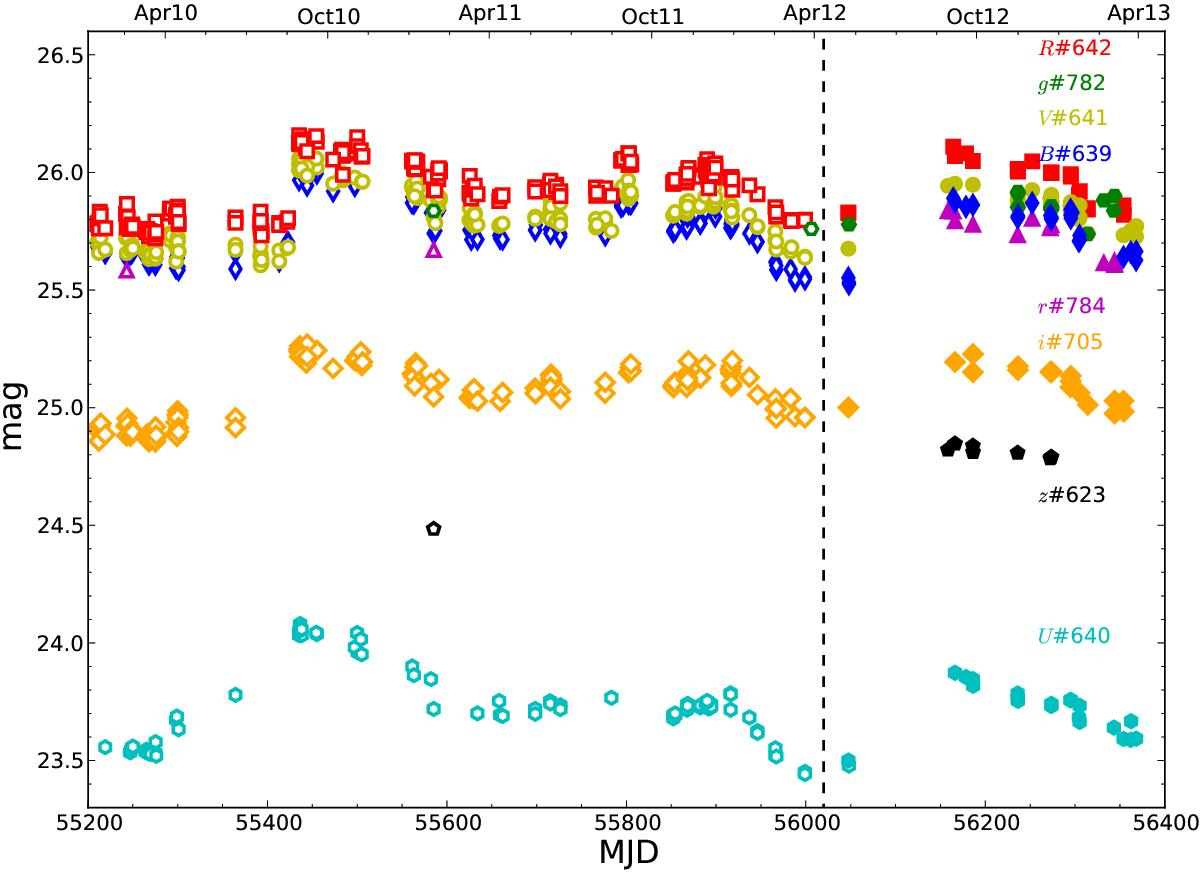
Evolution of NTT zero points between 2010 and 2013. PESSTO data are shown by filled symbols, while the open symbols refer to archival data. The vertical dashed line indicates the first PESSTO night. ZPs were evaluated from observations of PESSTO standard fields using the PESSTO pipeline.
Current usage metrics show cumulative count of Article Views (full-text article views including HTML views, PDF and ePub downloads, according to the available data) and Abstracts Views on Vision4Press platform.
Data correspond to usage on the plateform after 2015. The current usage metrics is available 48-96 hours after online publication and is updated daily on week days.
Initial download of the metrics may take a while.