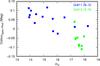
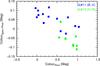
Fig. 13

A check on the relative flux calibration of the PESSTO spectra. The difference between the synthetic photometry colours of SN 2009ip (Gr#11) and SN 2013ai (Gr#13) and photometric measurements is plotted on the y-axis. The x-axis is simply the V-band photometric magnitude on the left panel and photometric colour (either B − V or V − R) on the right.
Current usage metrics show cumulative count of Article Views (full-text article views including HTML views, PDF and ePub downloads, according to the available data) and Abstracts Views on Vision4Press platform.
Data correspond to usage on the plateform after 2015. The current usage metrics is available 48-96 hours after online publication and is updated daily on week days.
Initial download of the metrics may take a while.