Fig. 11
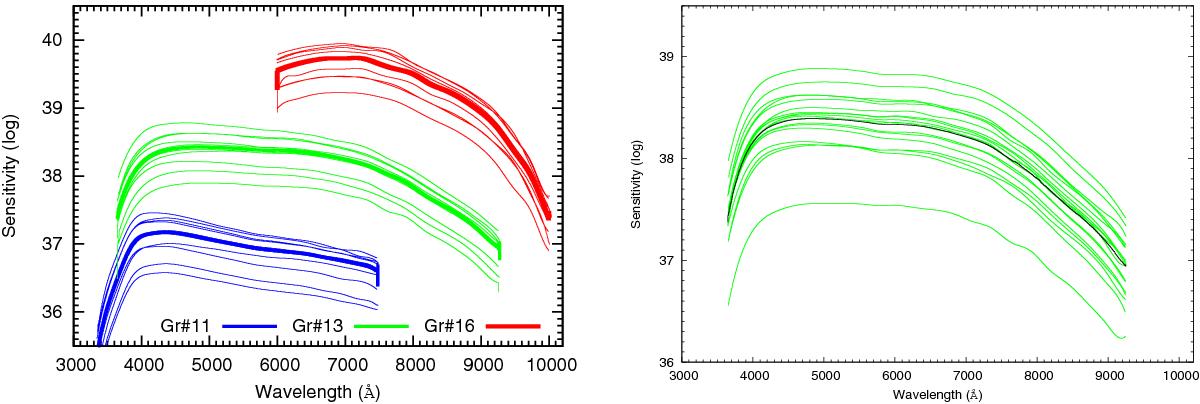
Left: average monthly sensitivity curves for Gr#11, Gr#13 and Gr#16, derived from spectrophotometric standards taken during the first year of PESSTO observations. The thick lines are annual sensitivity function. Thin lines are monthly averages (Gr#11 offset by − 1, Gr#16 offset by +1 for legibility) Right: as a comparison, the sensitivity curves from individual standard stars over ten nights in March 2013 (for Gr#13). Four different standards were observed, L745a, LTT3864, EG274, GD71. The master sensitivity curve for March 2013 with this configuration is shown in black.
Current usage metrics show cumulative count of Article Views (full-text article views including HTML views, PDF and ePub downloads, according to the available data) and Abstracts Views on Vision4Press platform.
Data correspond to usage on the plateform after 2015. The current usage metrics is available 48-96 hours after online publication and is updated daily on week days.
Initial download of the metrics may take a while.