Fig. 9
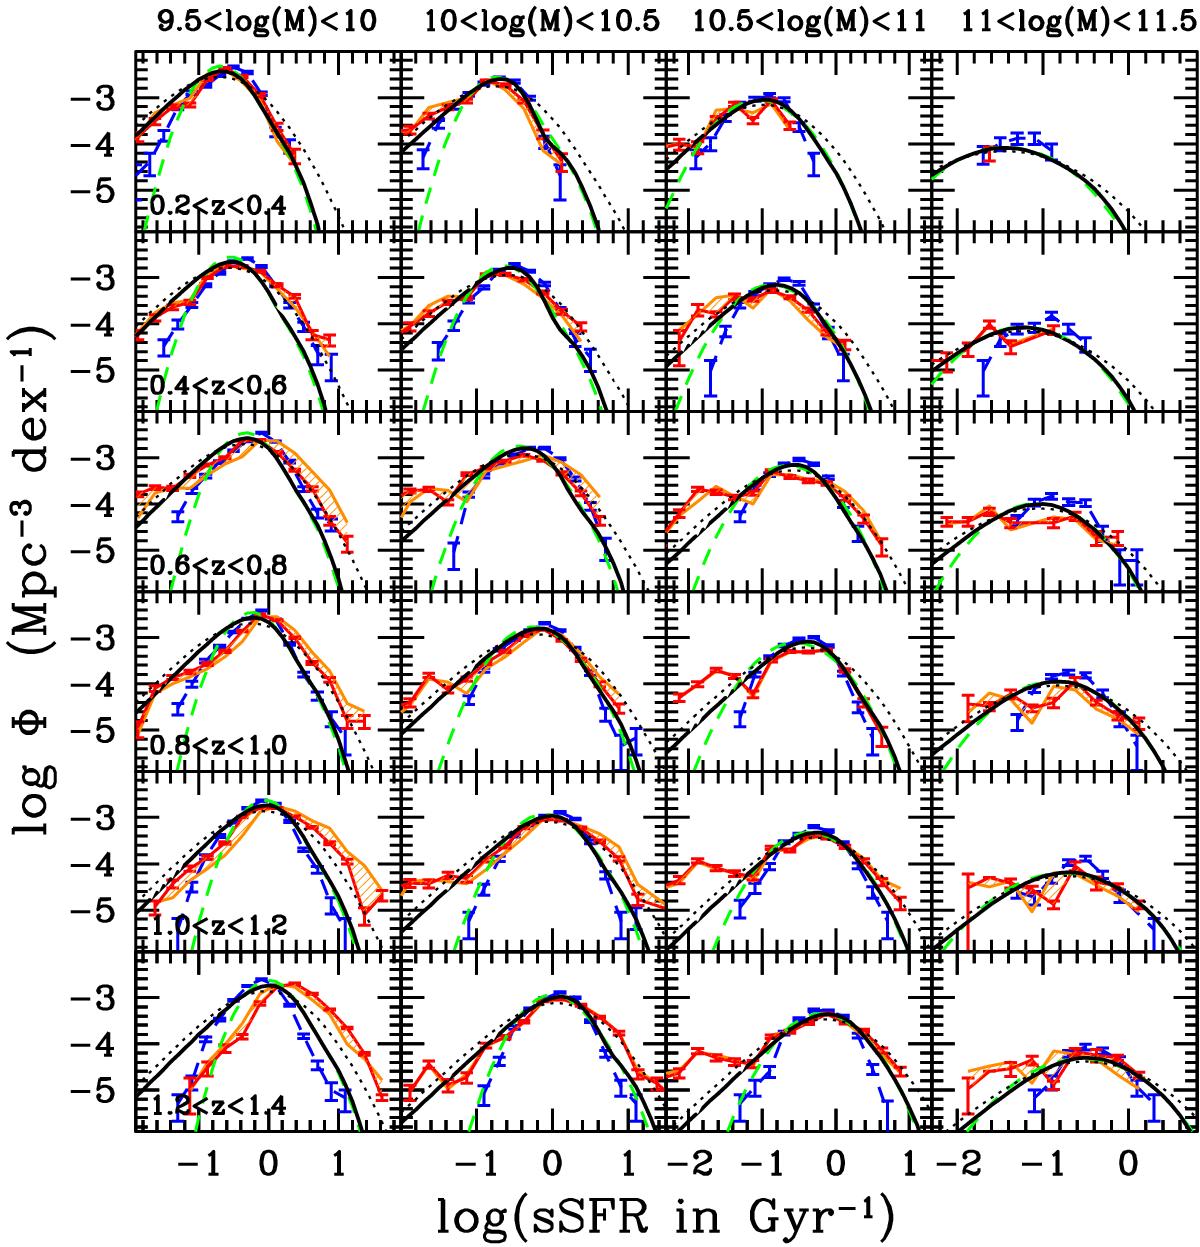
sSFR functions per redshift bin from 0.2 <z< 0.4 to 1.2 <z< 1.4 (from the top to the bottom rows) and per stellar mass bin from 9.5 < log (M⋆) < 10 to 11 < log (M⋆) < 11.5 (from the left to the right columns). The black solid lines and green dashed lines correspond to the best-fit sSFRUV+IR functions assuming a double-exponential and a log-normal profile, respectively (as shown in Fig. 4). The dotted lines correspond to the same function convolved with a Gaussian having σ = 0.3 dex to mimic the expected uncertainties on SFRSED. The sSFRNRK functions are shown with blue error bars and dashed lines. They are derived using an optical tracer of the SFR developed by Arnouts et al. (2013). The red and orange lines are obtained using SFRSED with and without a correction for possible biases in SFRSED.
Current usage metrics show cumulative count of Article Views (full-text article views including HTML views, PDF and ePub downloads, according to the available data) and Abstracts Views on Vision4Press platform.
Data correspond to usage on the plateform after 2015. The current usage metrics is available 48-96 hours after online publication and is updated daily on week days.
Initial download of the metrics may take a while.