Fig. 8
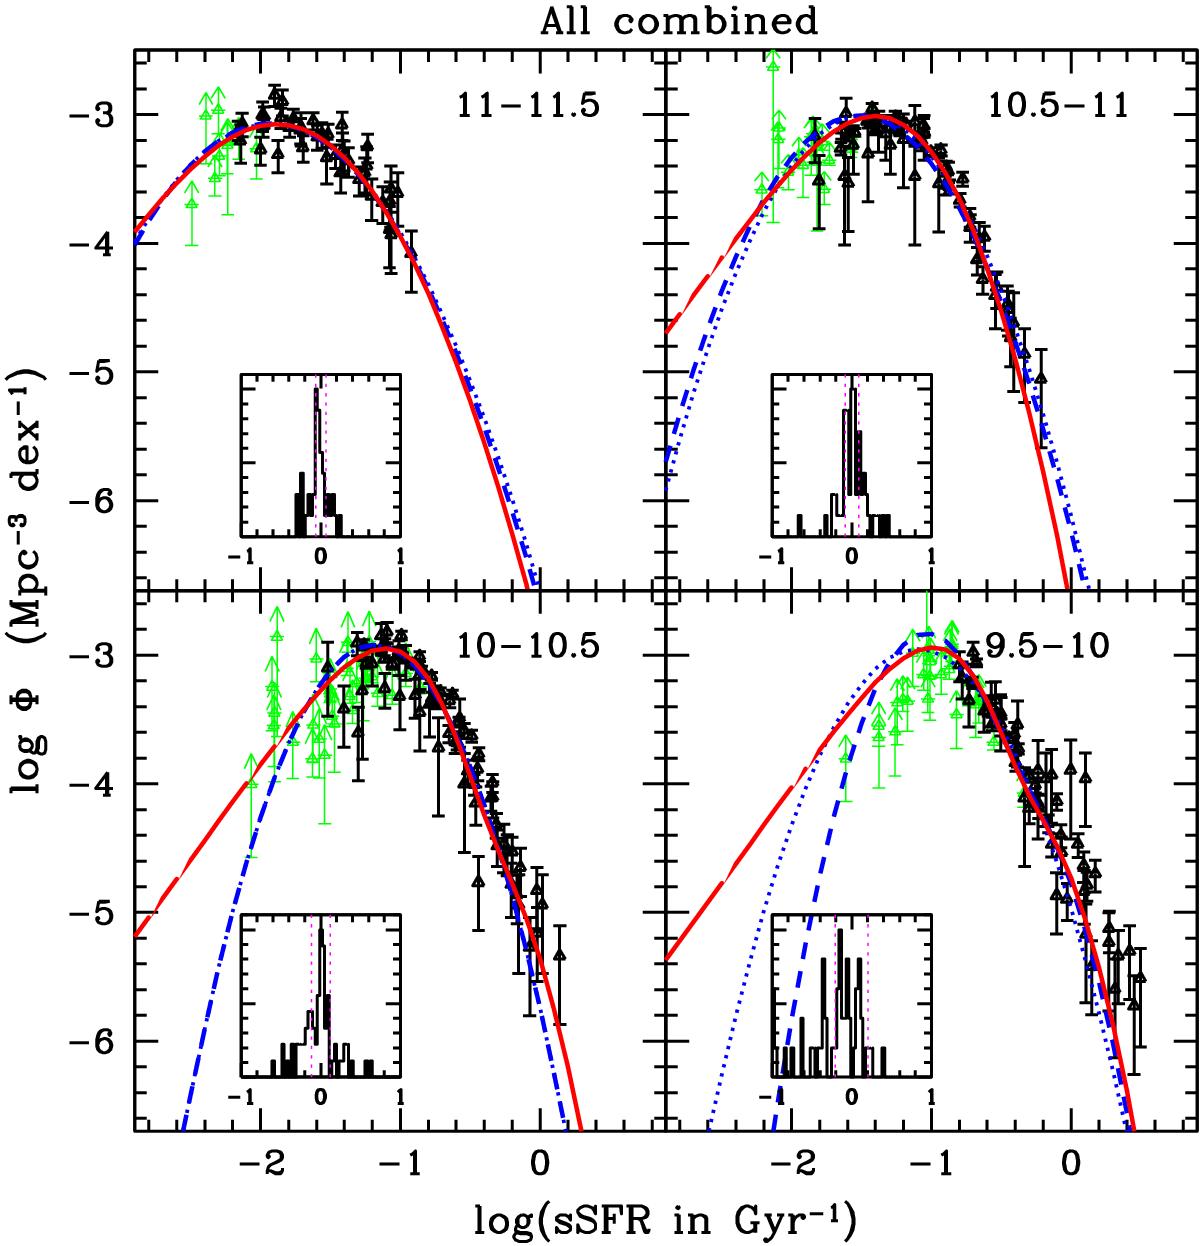
sSFR functions combined at z = 0 correcting the 1/Vmax data from the redshift evolution derived in Sect. 4.3. Each panel corresponds to a stellar mass bin. The black triangles are obtained with the 1/Vmax estimator over the COSMOS and the GOODS fields (mixed together in this figure). The green arrows are lower limits in the 1/Vmax estimate. The red solid lines and blue dashed lines correspond to the best-fit of a double-exponential and a log-normal function over the 1/Vmax data. The blue dotted line corresponds to the fit of a Gaussian function without including a starburst component. The inset in each panel shows the distribution of the differences between the best-fit function and the data, with a density dispersion of 0.19 dex at log (M⋆) = 9.5−10, 0.11 dex at log (M⋆) = 10−10.5, 0.09 dex at log (M⋆) = 10.5−11, and 0.07 dex at log (M⋆) = 11−11.5, as shown by the vertical dashed lines.
Current usage metrics show cumulative count of Article Views (full-text article views including HTML views, PDF and ePub downloads, according to the available data) and Abstracts Views on Vision4Press platform.
Data correspond to usage on the plateform after 2015. The current usage metrics is available 48-96 hours after online publication and is updated daily on week days.
Initial download of the metrics may take a while.