Fig. 7
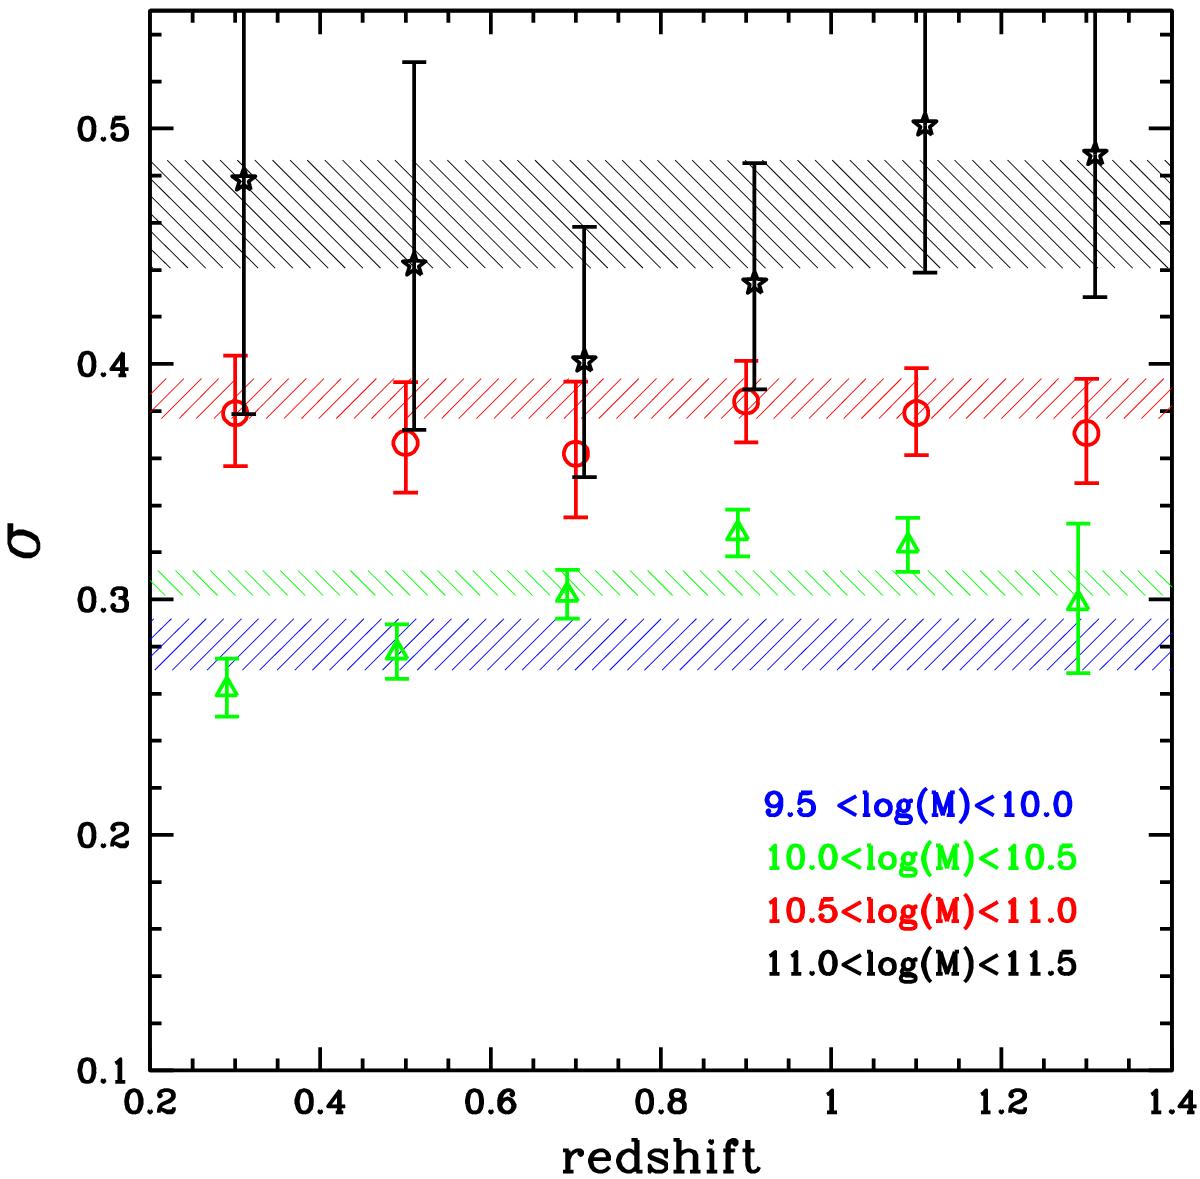
Evolution of the parameter σ as a function of redshift, obtained by fitting a log-normal function to the 1/Vmax data. Each color corresponds to a stellar mass bin (blue: 9.5 < log (M⋆) < 10, green: 10–10.5, red: 10.5–11 and black 11–11.5). The shaded areas correspond to the value measured when all the sSFR functions are combined at z = 0 as shown in Fig. 8. The individual σ points are not measured at 9.5 < log (M⋆) < 10 since we set the value of σ in this mass range.
Current usage metrics show cumulative count of Article Views (full-text article views including HTML views, PDF and ePub downloads, according to the available data) and Abstracts Views on Vision4Press platform.
Data correspond to usage on the plateform after 2015. The current usage metrics is available 48-96 hours after online publication and is updated daily on week days.
Initial download of the metrics may take a while.