Fig. 5
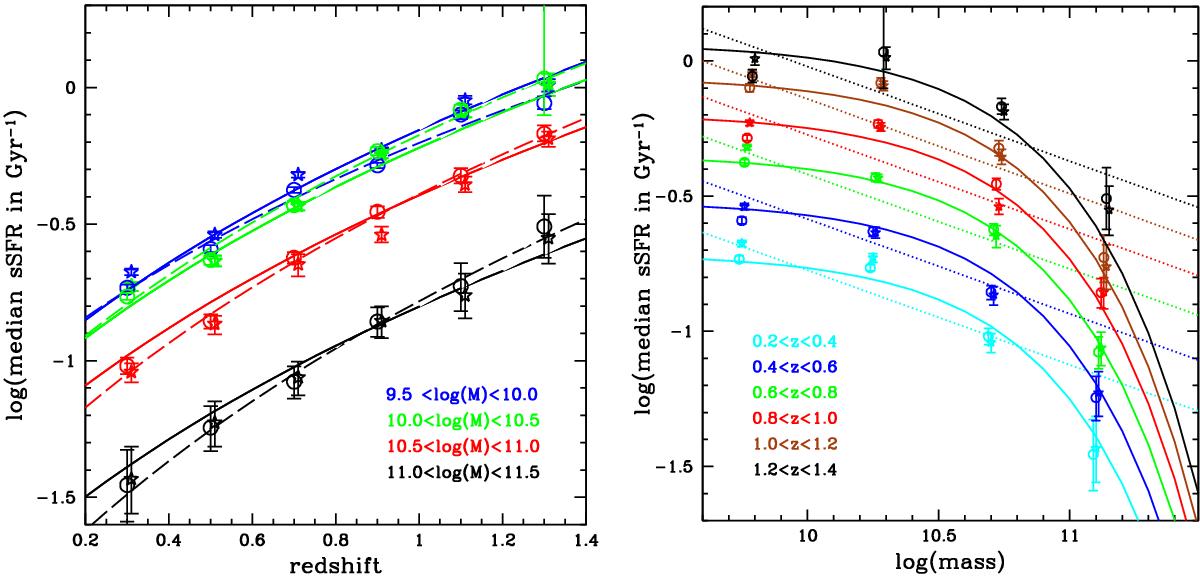
Evolution of the median sSFR as a function of redshift (left panel) and stellar mass (right panel). Open stars and open circles correspond to the values measured assuming a log-normal and a double-exponential profiles, respectively. The solid lines correspond to the fit using Eq. (5) and b independent of M⋆. Left: each color corresponds to a stellar mass bin (blue: 9.5−10 dex, green: 10−10.5, red: 10.5−11 and black 11−11.5). The dashed lines are obtained with b varying in each mass bin. Right: each color corresponds to a redshift bin from 0.2−0.4 (cyan) to 1.2−1.4 (black). The dotted lines are obtained using log (sSFR) ∝ log (M⋆) (i.e., the standard definition in the literature). The solid line corresponds to log (sSFR) ∝ −0.17 M⋆
Current usage metrics show cumulative count of Article Views (full-text article views including HTML views, PDF and ePub downloads, according to the available data) and Abstracts Views on Vision4Press platform.
Data correspond to usage on the plateform after 2015. The current usage metrics is available 48-96 hours after online publication and is updated daily on week days.
Initial download of the metrics may take a while.