Fig. 4
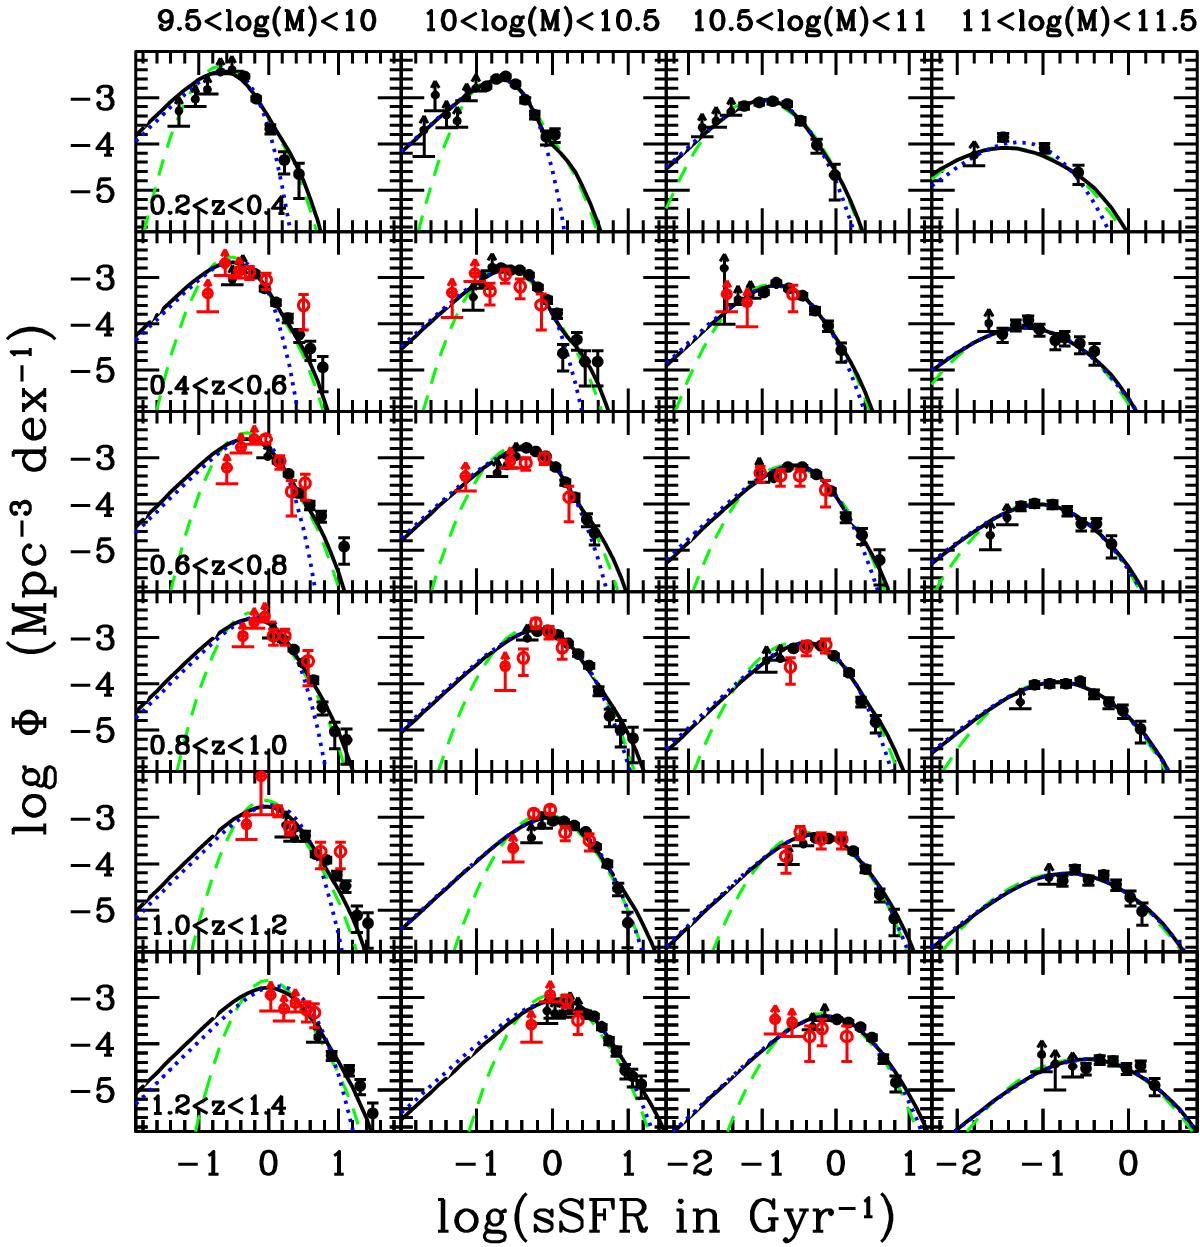
sSFR functions per redshift bin from 0.2 <z< 0.4 to 1.2 <z< 1.4 (from the top to the bottom rows) and per stellar mass bin from 9.5 < log (M⋆) < 10 to 11 < log (M⋆) < 11.5 (from the left to the right columns). The non-parametric data have been obtained using the 1/Vmax estimator. The black filled and red open circles correspond to the COSMOS and GOODS fields, respectively. The arrows correspond to the lower limits obtained with the 1/Vmax. The black solid lines and green dashed lines correspond to the best-fit functions assuming a double-exponential and a log-normal profile, respectively. Both include a starburst component (see details in Sect. 4.2). The blue dotted lines correspond to the double-exponential fit without considering the starburst component.
Current usage metrics show cumulative count of Article Views (full-text article views including HTML views, PDF and ePub downloads, according to the available data) and Abstracts Views on Vision4Press platform.
Data correspond to usage on the plateform after 2015. The current usage metrics is available 48-96 hours after online publication and is updated daily on week days.
Initial download of the metrics may take a while.