Fig. B.1
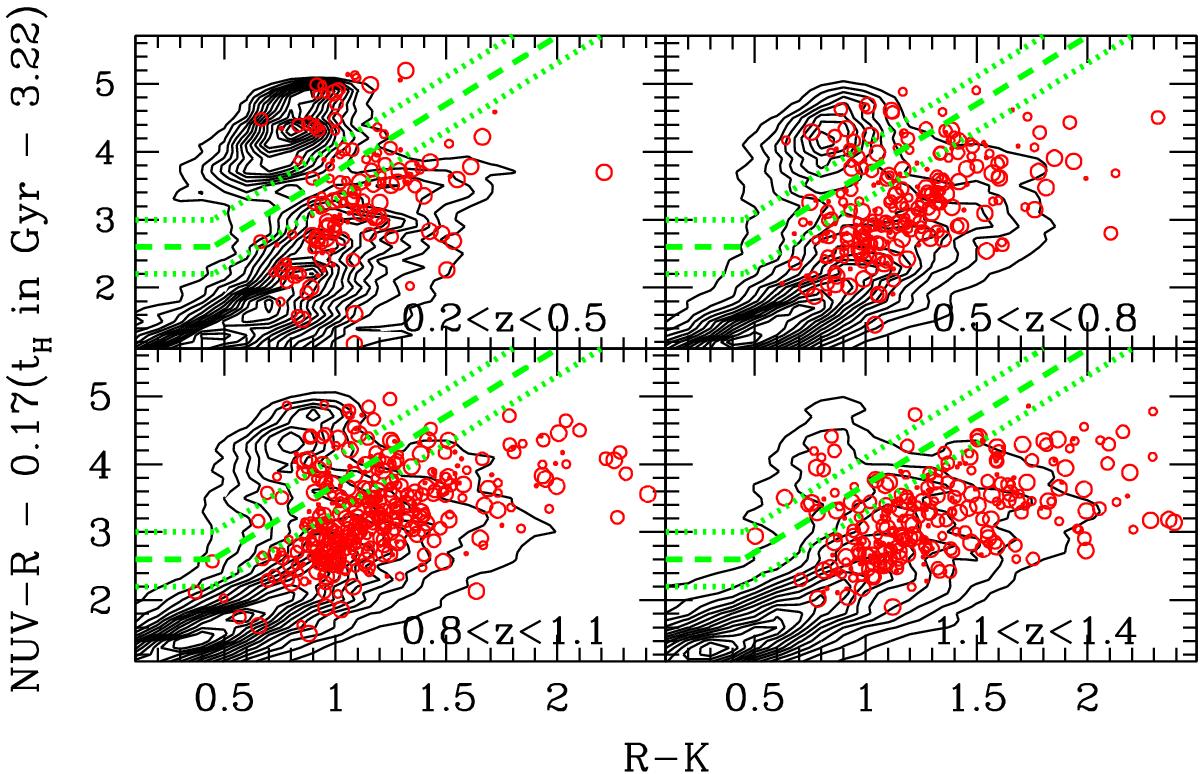
Same as Fig. 2, except that the red circles are the massive 24 μm sources (11 < log (M⋆) < 11.5) and the size of the sources is proportional to the 24 μm flux. The contours refer to the full galaxy sample at log (M⋆) > 9.5. The largest fraction of massive galaxies are well below the selection criterion and the brightest ones are located in top right part of the diagram with the most extinguished sources.
Current usage metrics show cumulative count of Article Views (full-text article views including HTML views, PDF and ePub downloads, according to the available data) and Abstracts Views on Vision4Press platform.
Data correspond to usage on the plateform after 2015. The current usage metrics is available 48-96 hours after online publication and is updated daily on week days.
Initial download of the metrics may take a while.