Fig. A.1
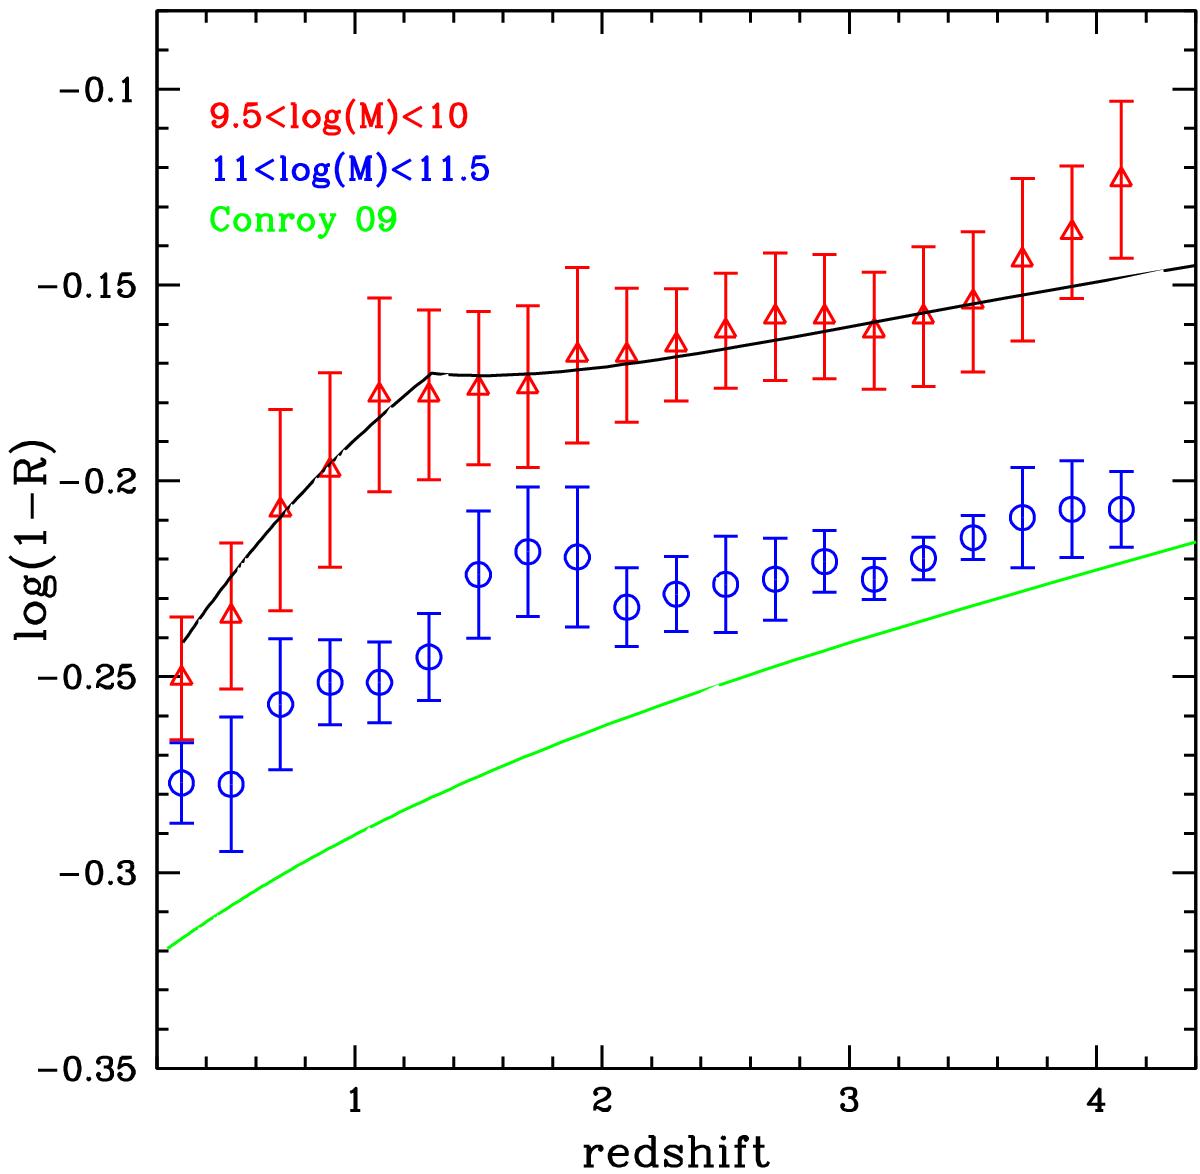
Open triangles and open circles represent the median (1−R) obtained for a low-mass galaxy sample (9.5 < log (M⋆) < 10) and high-mass sample (11 < log (M⋆) < 11.5), respectively. The green curves correspond to the mass loss parametrized by Conroy & Wechsler (2009) assuming the same redshift of formation z = 10 for all the stars. The black line is the parametrization that we adopt as a lower limit for the return fraction.
Current usage metrics show cumulative count of Article Views (full-text article views including HTML views, PDF and ePub downloads, according to the available data) and Abstracts Views on Vision4Press platform.
Data correspond to usage on the plateform after 2015. The current usage metrics is available 48-96 hours after online publication and is updated daily on week days.
Initial download of the metrics may take a while.