Fig. 14
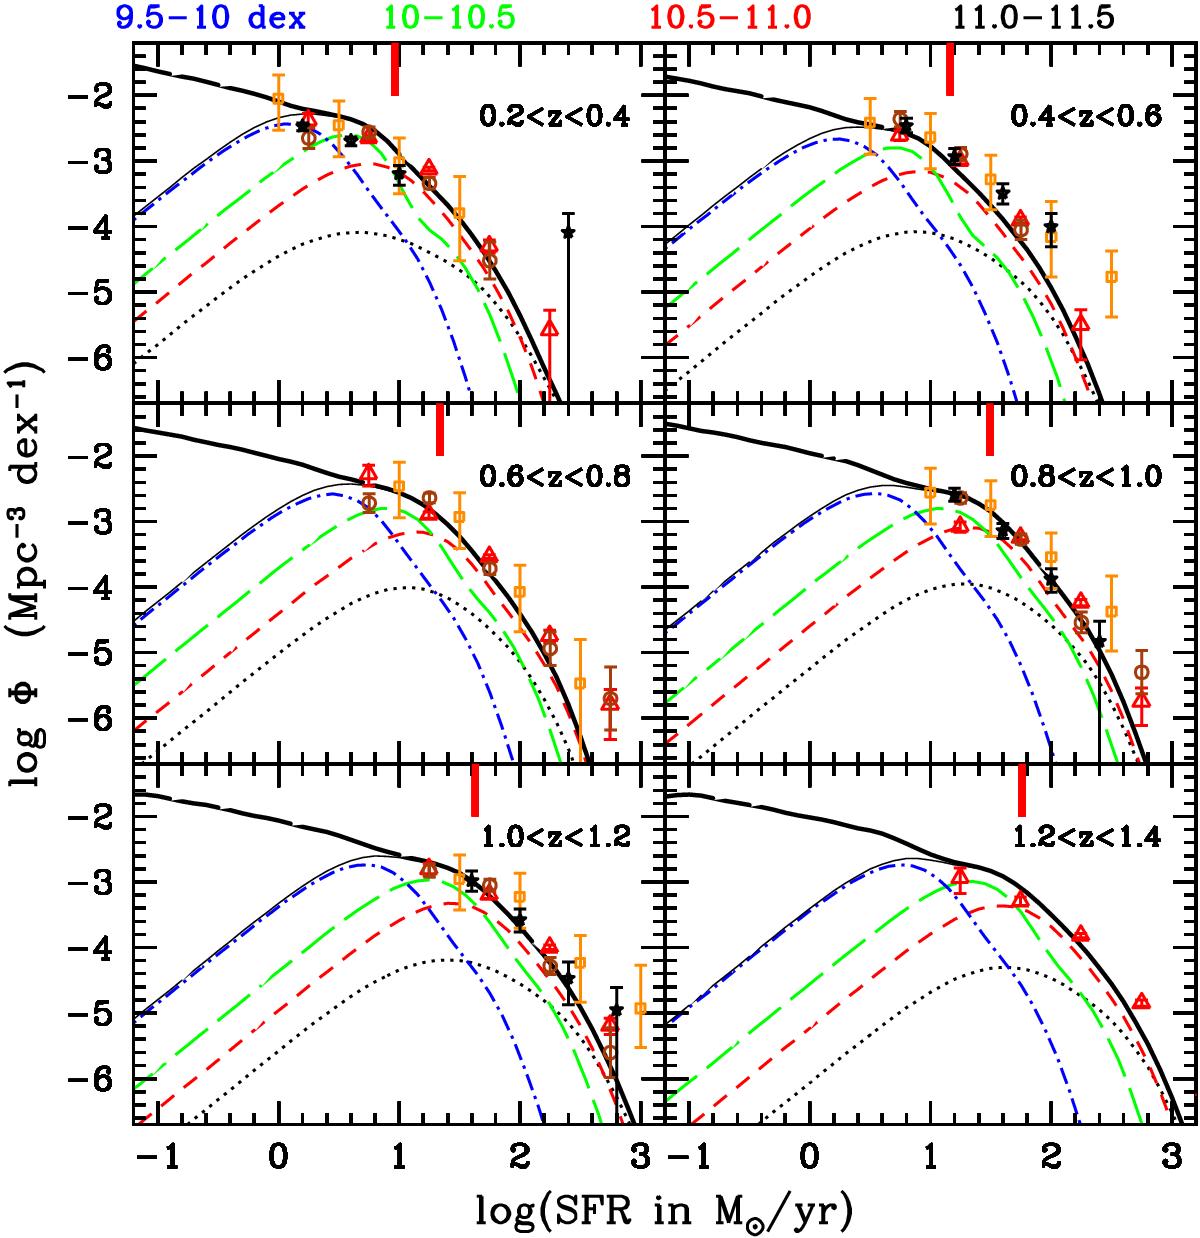
SFR function per redshift bin (from 0.2 <z< 0.4 in the top left panel to 1.2 <z< 1.4 in the bottom right panel) and per stellar mass bin (dashed-dot blue: 9.5–10 dex, long-dashed green: 10–10.5, short-dashed red: 10.5–11 and dotted black 11–11.5). We show only the best-fit functions using a double-exponential profile and their sum corresponds to the light black solid line. The full SFR function obtained by extrapolating the contribution of galaxies at M⋆ < 109.5 M⊙ is shown with the thick solid black line. The points correspond to IR luminosity functions from the literature converted into SFR functions (red open triangles: Gruppioni et al. 2013; orange open squares: Le Floc’h et al. 2005; brown open circles: Rodighiero et al. 2010; black filled stars: Magnelli et al. 2009). The thick red vertical lines indicate the location of SFRknee (log 10(SFRknee) = 0.96, 1.16, 1.34, 1.49, 1.63, 1.76 at z = 0.2–0.4, 0.4–0.6, 0.6–0.8, 0.8–1, 1–1.2, 1.2–1.4)
Current usage metrics show cumulative count of Article Views (full-text article views including HTML views, PDF and ePub downloads, according to the available data) and Abstracts Views on Vision4Press platform.
Data correspond to usage on the plateform after 2015. The current usage metrics is available 48-96 hours after online publication and is updated daily on week days.
Initial download of the metrics may take a while.