Fig. 13
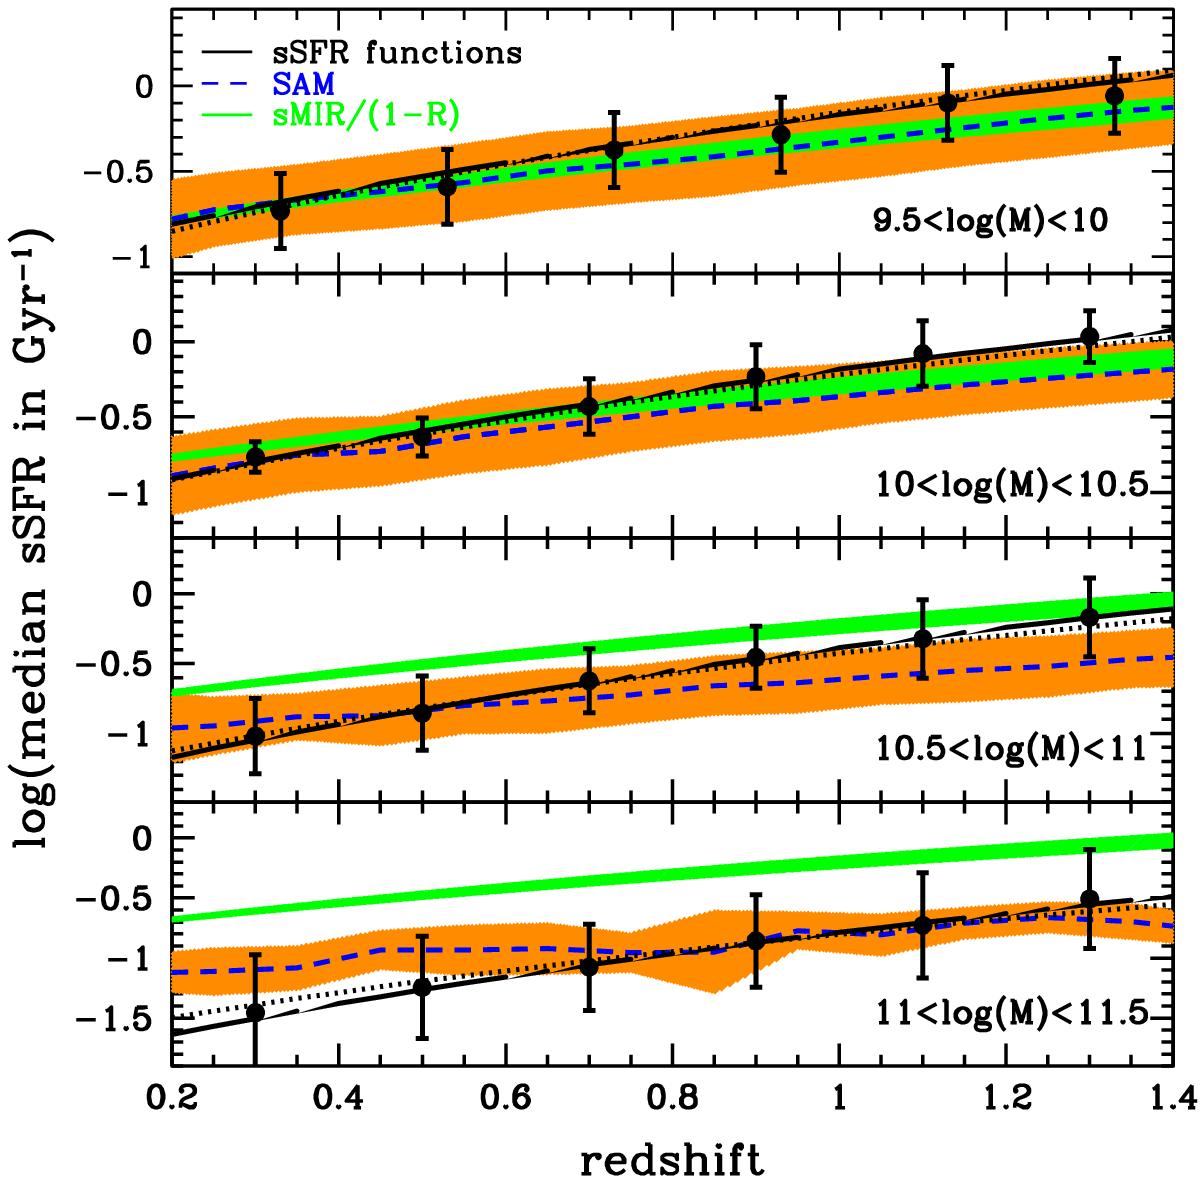
Evolution of the median sSFR as a function of redshift. Each panel corresponds to a stellar mass bin. The blue dashed lines correspond to the median sSFR expected from the semi-analytical model. The orange area is derived by measuring the rms of the sSFR in the semi-analytical model. The solid circles correspond to the median sSFR measured in this work. The vertical error bars indicate the σ derived from the fit with a log-normal function (i.e., the intrinsic scatter of the M⋆−sSFR relation). The solid (dotted) lines correspond to the fit over the data using Eq. (5) assuming that b does (does not) depend on the mass. The green shaded area corresponds to the analytical relation from Neistein & Dekel (2008) to describe the sMIR evolution, corrected for the mass loss as discussed in Appendix A.
Current usage metrics show cumulative count of Article Views (full-text article views including HTML views, PDF and ePub downloads, according to the available data) and Abstracts Views on Vision4Press platform.
Data correspond to usage on the plateform after 2015. The current usage metrics is available 48-96 hours after online publication and is updated daily on week days.
Initial download of the metrics may take a while.