Fig. 12
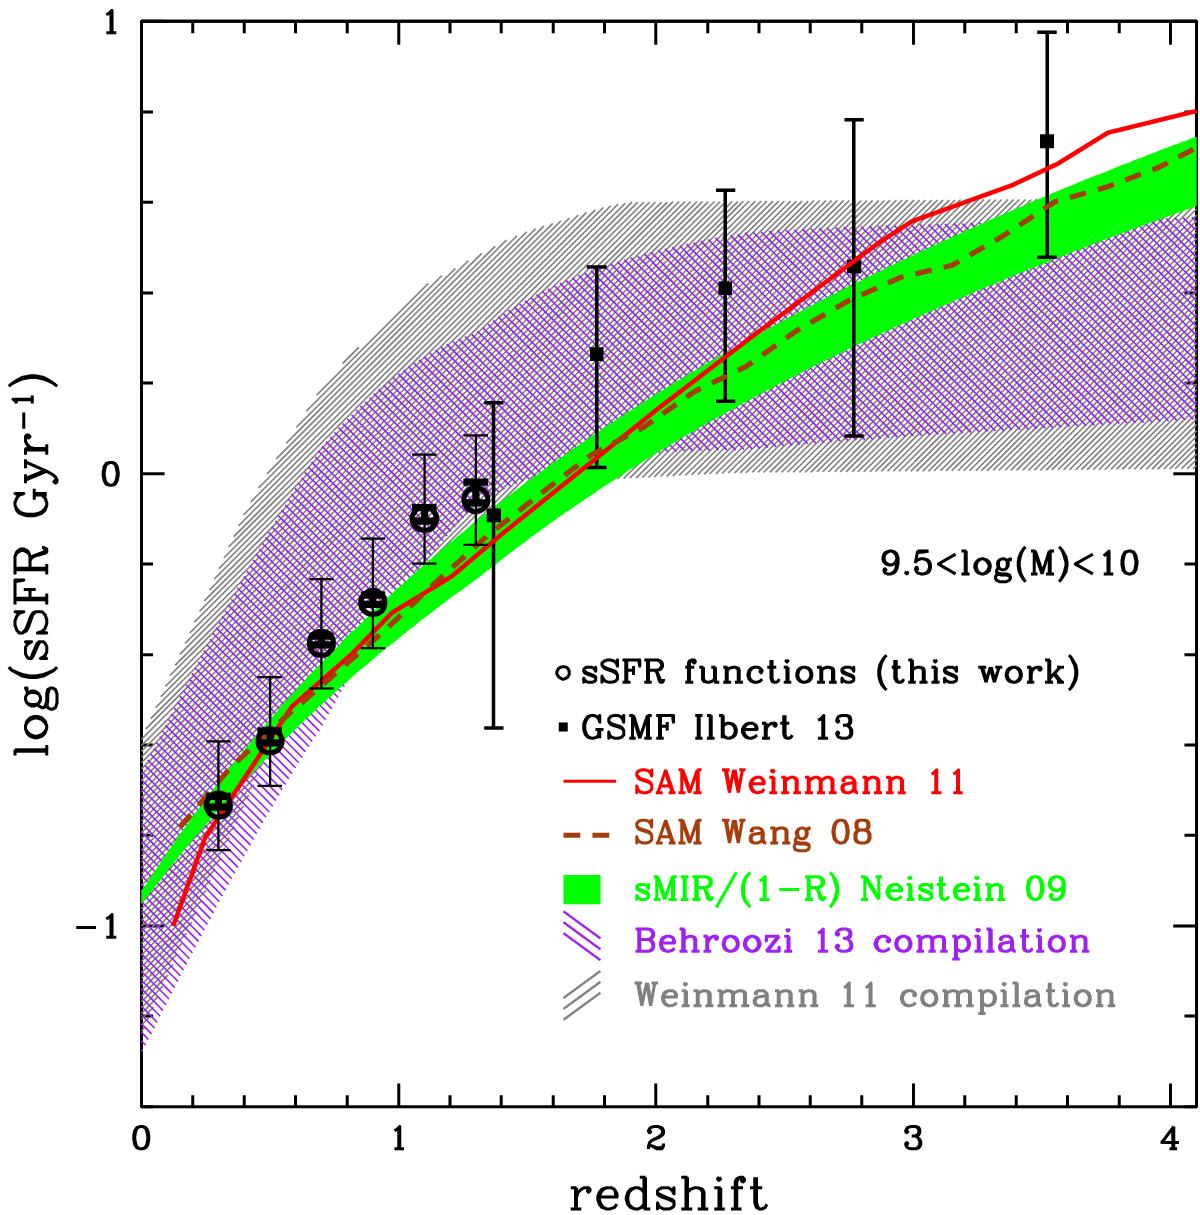
Evolution of the median sSFR derived from the sSFR functions at 9.5 < log (M⋆ /M⊙) < 10 (open black circles). The statistical uncertainties on the median sSFR are within the symbols. Systematic uncertainties (±0.1 dex in stellar mass and + 0.1 dex in SFR) are indicated with thin error bars. The sSFR derived indirectly from the UltraVISTA mass functions are indicated with filled black squares. The gray and purple shaded areas correspond to the data compilations from Weinmann et al. (2011) and Behroozi et al. (2013), respectively. The prediction of the SAM from Weinmann et al. (2011) and Wang et al. (2008) are shown with the red and brown lines. The green shaded area corresponds to the analytical relation from Neistein & Dekel (2008) to describe the sMIR evolution, corrected for the mass loss as discussed in Appendix A.
Current usage metrics show cumulative count of Article Views (full-text article views including HTML views, PDF and ePub downloads, according to the available data) and Abstracts Views on Vision4Press platform.
Data correspond to usage on the plateform after 2015. The current usage metrics is available 48-96 hours after online publication and is updated daily on week days.
Initial download of the metrics may take a while.