Fig. 9
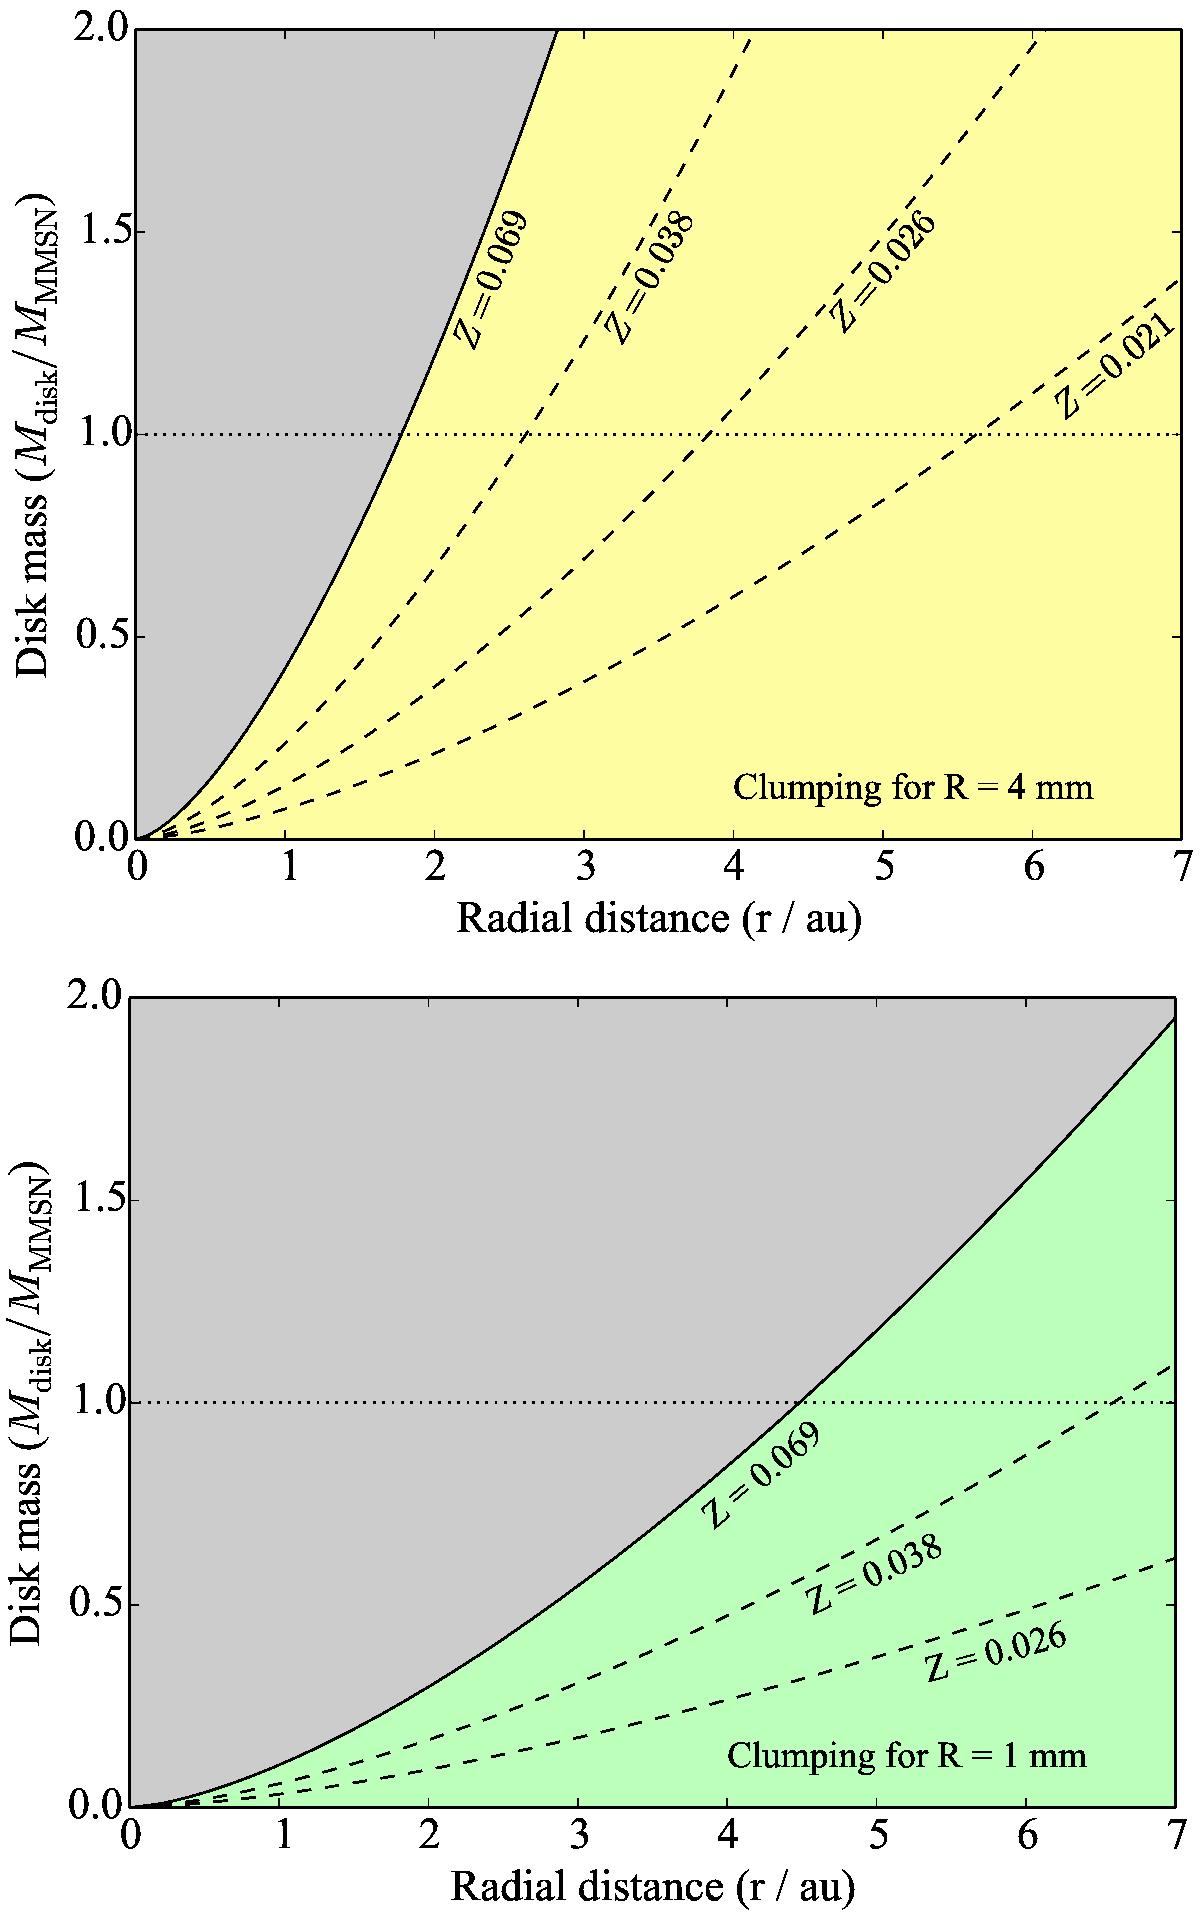
Location of the asteroid forming region in terms of disk mass Mdisk and semimajor axis r. This can also be thought of as a “disk age vs. r” phase space. The disk mass is measured in terms of the minimum-mass solar nebula (MMMSN). The top plot shows the region where R = 4mm chondrule aggregates can form clumps. The solid and dashed lines are lines of constant particle Stokes number τf = 0.0032, 0.0056, 0.01, and 0.0178. To form clumps, these particles require a solid concentration of Z = 0.069, 0.038, 0.026, and 0.021 respectively (see Fig. 8). The bottom plot shows the same regions for R = 1mm chondrules. As the disk evolves, and the disk mass drops, the planetesimal forming region moves closer to the star.
Current usage metrics show cumulative count of Article Views (full-text article views including HTML views, PDF and ePub downloads, according to the available data) and Abstracts Views on Vision4Press platform.
Data correspond to usage on the plateform after 2015. The current usage metrics is available 48-96 hours after online publication and is updated daily on week days.
Initial download of the metrics may take a while.