Fig. 8
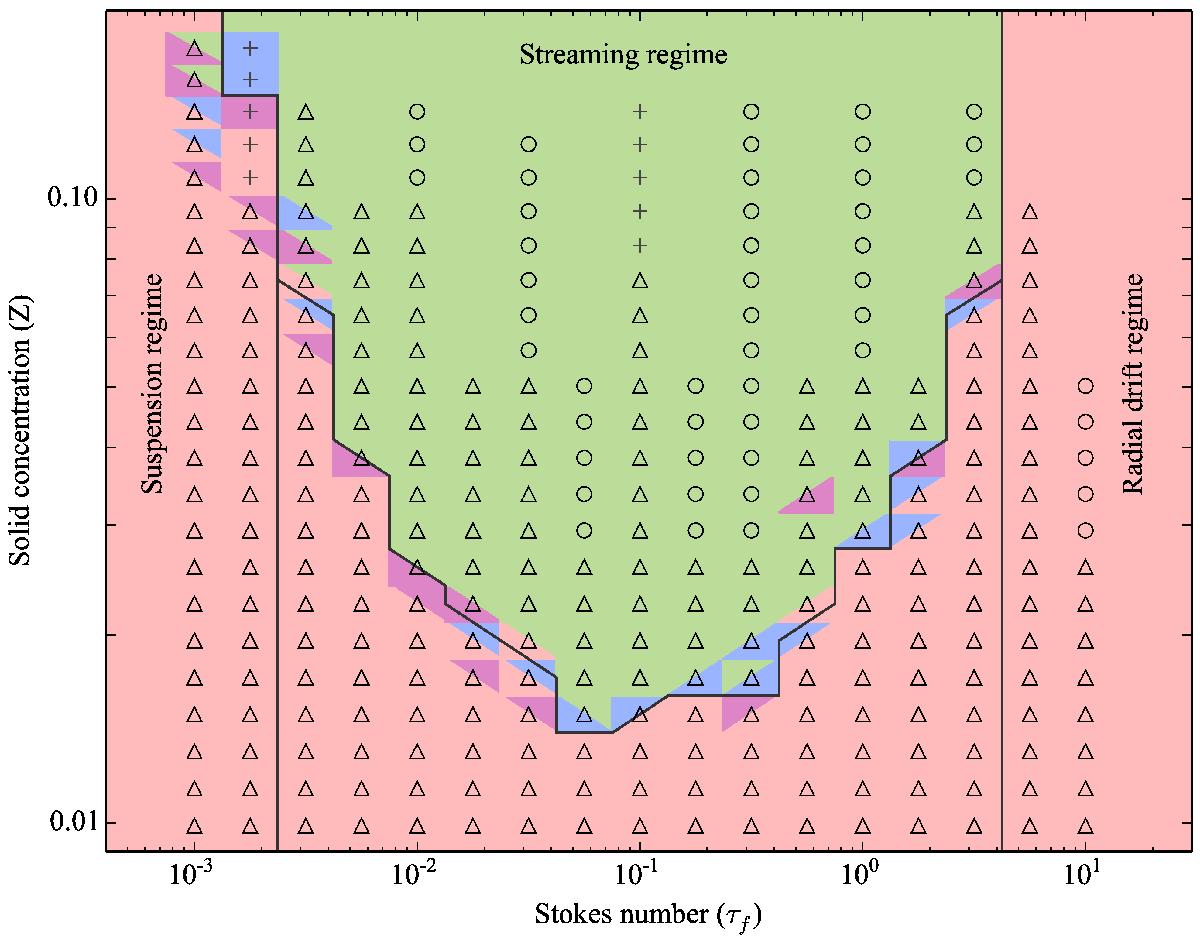
Region of the particle size vs. concentration phase space where the streaming instability is active. Particle size is measured in the stopping time τf and the particle concentration is Z = Σsolid/ Σtotal. The colors mark the probability that particle clumps can form, where red is “unlikely”, magenta is “somewhat likely”, blue is “likely”, and green is “very likely”. See Appendix A for the precise definitions and methods. When different simulations give different results, the two extreme values are shown. For example, if two simulations give “likely” and one gives “unlikely”, this is expressed as a square that is half red, half green. The symbols indicate the number of simulations available for the result. A triangle means three simulation, a cross means two, and a circle means one. Regions without symbols are extrapolations. The black lines indicate our (subjective) assessment of main regions where the behavior of particles is qualitatively different.
Current usage metrics show cumulative count of Article Views (full-text article views including HTML views, PDF and ePub downloads, according to the available data) and Abstracts Views on Vision4Press platform.
Data correspond to usage on the plateform after 2015. The current usage metrics is available 48-96 hours after online publication and is updated daily on week days.
Initial download of the metrics may take a while.