Fig. 4
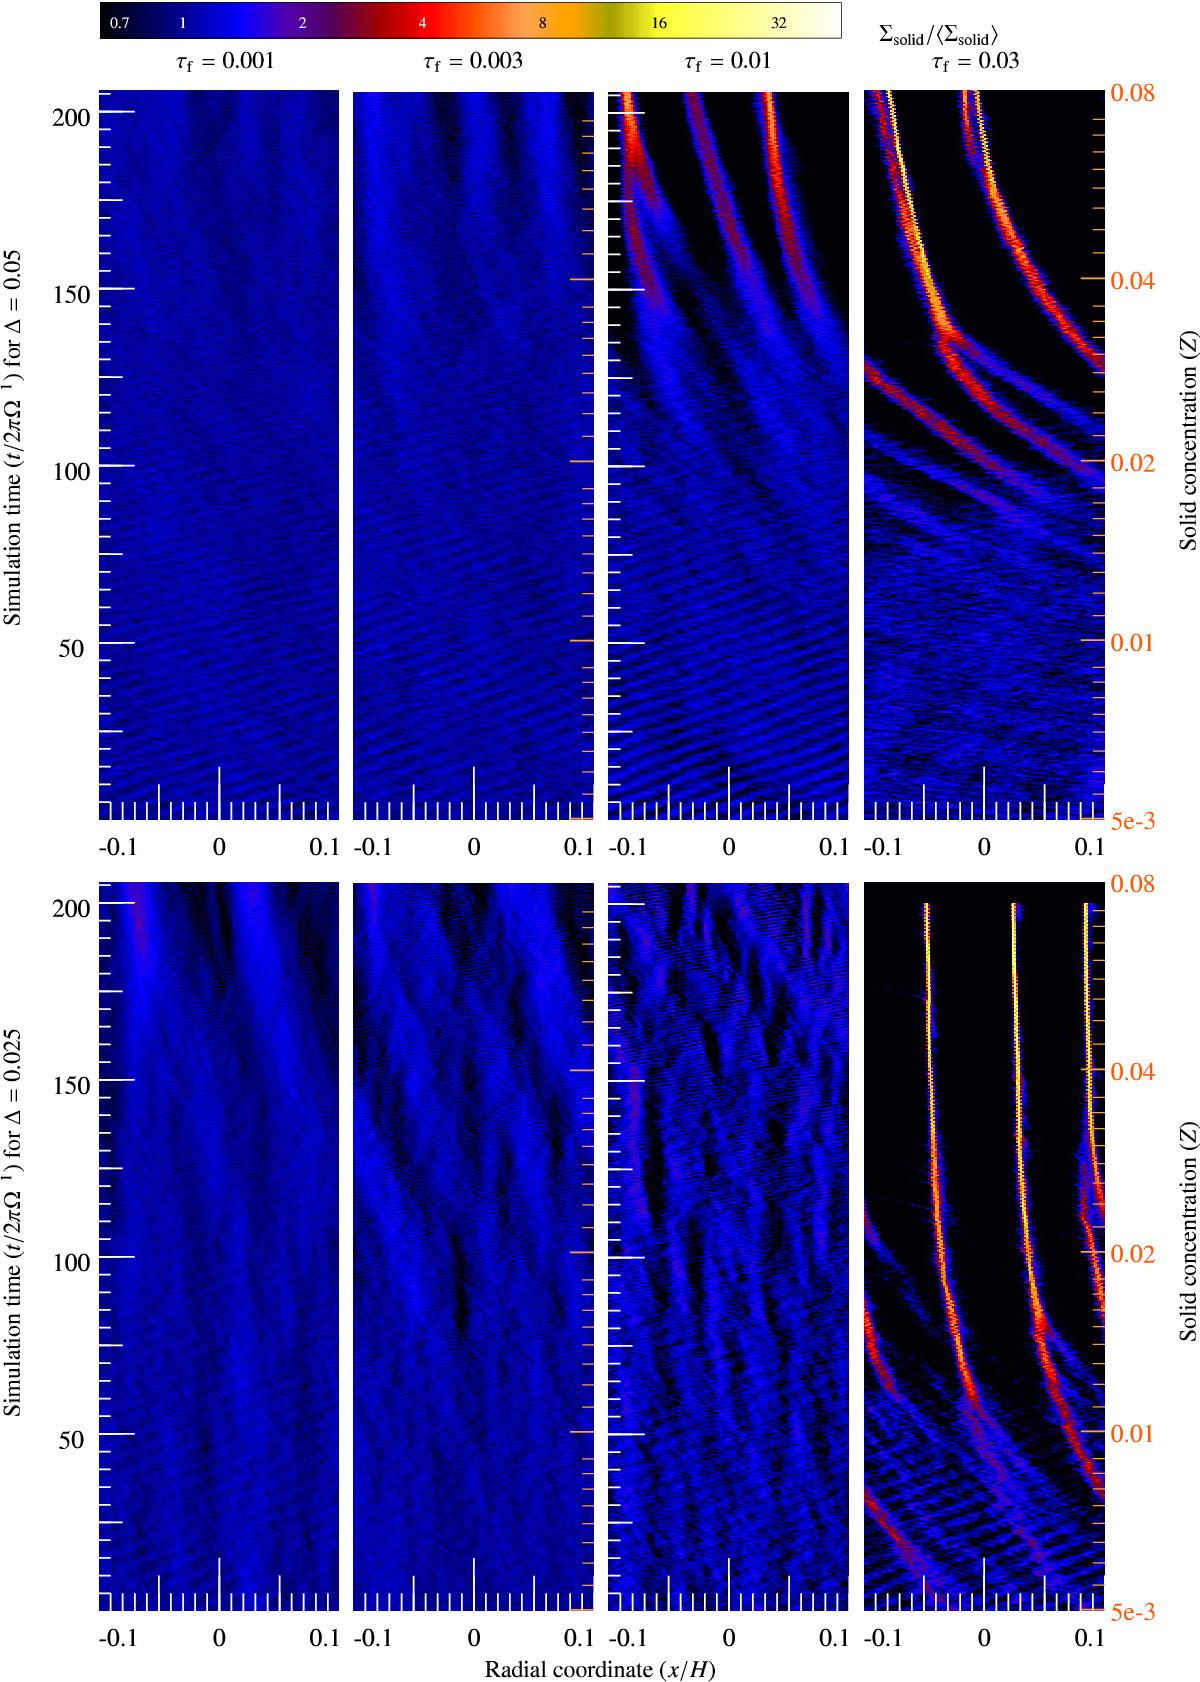
Spacetime diagrams showing the solid surface density Σsolid as a function of the radial coordinate x and simulation time. The right hand axis shows the mean solid concentration Z = ⟨ Σsolid ⟩ / ⟨ Σtotal ⟩. The figure shows selected runs with τf ≤ 0.03. The top row has runs with standard pressure support (Δ = 0.05) and the bottom row has runs with a reduced pressure support (Δ = 0.025). The surface density is shown by a color scale. Some of the runs form visible filaments. For Δ = 0.05 there is a clear trend where lower τf requires higher Z to form filaments. For Δ = 0.025 the behavior is less predictable – while the particle concentration is higher, the low radial drift speed interferes with the streaming instability.
Current usage metrics show cumulative count of Article Views (full-text article views including HTML views, PDF and ePub downloads, according to the available data) and Abstracts Views on Vision4Press platform.
Data correspond to usage on the plateform after 2015. The current usage metrics is available 48-96 hours after online publication and is updated daily on week days.
Initial download of the metrics may take a while.