Fig. 3
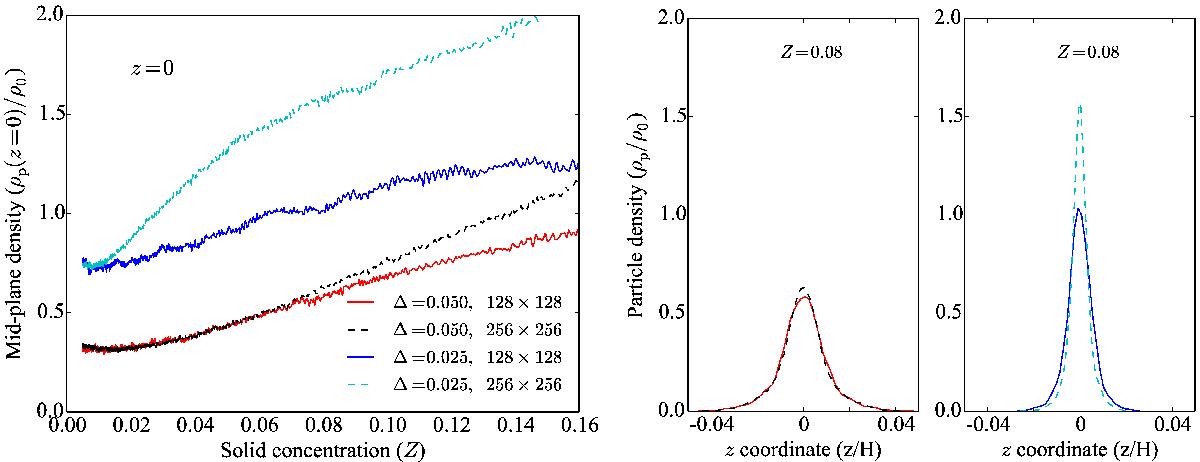
Particle density ρp as a function of solid concentration (left) and height (right). The solid concentration is Z = Σsolid/ Σtotal. The left figure shows ρp at the midplane (height z = 0) as a function of Z. The right figure shows ρp at Z = 0.08 as a function of the z coordinate. The particle density is measured in terms of the initial gas density ρ0. All the simulations have particle size τf = 0.002. Two runs have a standard pressure support (Δ = 0.05) and two have a reduced pressure support (Δ = 0.025). Two runs have 128 × 128 grid resolution and two are 256 × 256. There is no evidence of the density cusp predicted by Sekiya (1998) and Youdin & Shu (2002). The Δ = 0.05 and Δ = 0.025 runs should have clear cusps after Z ~ 0.10 and Z ~ 0.02 respectively (Youdin & Shu 2002). These simulations may have an additional source of mixing that inhibits the formation of the Sekiya-Youdin-Shu cusp. The result is the same for smaller, τf = 0.001 particles (not shown).
Current usage metrics show cumulative count of Article Views (full-text article views including HTML views, PDF and ePub downloads, according to the available data) and Abstracts Views on Vision4Press platform.
Data correspond to usage on the plateform after 2015. The current usage metrics is available 48-96 hours after online publication and is updated daily on week days.
Initial download of the metrics may take a while.