Fig. B.5
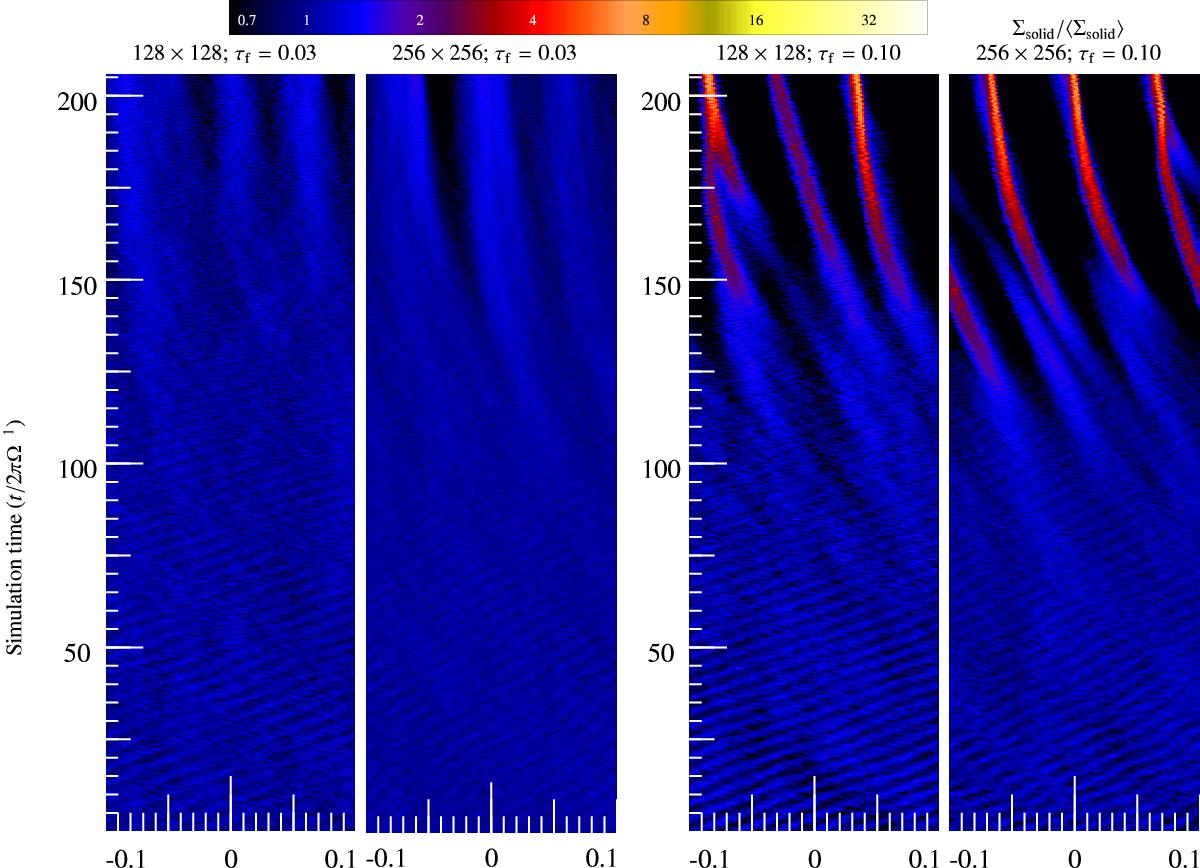
Spacetime diagrams showing the solid surface density Σsolid as a function of the radial coordinate x and simulation time τf = 0.003 and τf = 0.010 particles. The surface density is shown by color, using the same color scale as in Figs. 4 and 5. The figure shows both 128 × 128 simulations and the corresponding 256 × 256 simulations. In all simulations Δ = 0.05. The higher-resolution runs produce results consistent with the 128 × 128 runs.
Current usage metrics show cumulative count of Article Views (full-text article views including HTML views, PDF and ePub downloads, according to the available data) and Abstracts Views on Vision4Press platform.
Data correspond to usage on the plateform after 2015. The current usage metrics is available 48-96 hours after online publication and is updated daily on week days.
Initial download of the metrics may take a while.