Fig. B.4
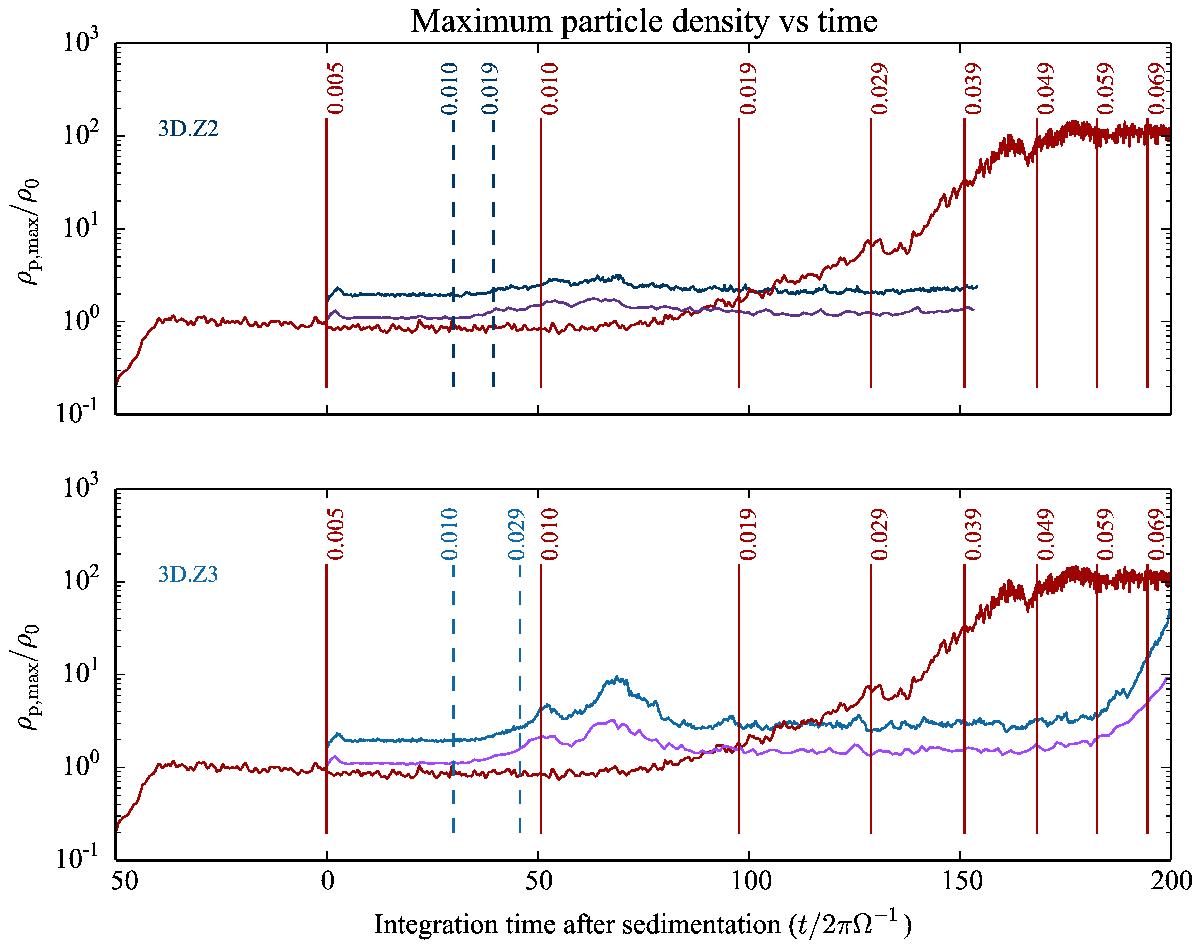
Maximum particle density (ρp,max) for one of the 2D simulations and the two 3D simulations. The top plot compares run 3D.Z2 (blue) and a 2D run (red). The bottom plot compares run 3D.Z3 (blue) and the same 2D run (red). In each plot the purple line shows ρp,max for the 3D run after averaging along the azimuthal direction. The vertical dashed lines mark the places where the 3D runs transition from Z = 0.01 to Z = 0.019 (for 3D.Z2) or Z = 0.029 (for 3D.Z3). Similarly, the vertical solid lines mark the progressive increase of Z during the course of the 2D runs.
Current usage metrics show cumulative count of Article Views (full-text article views including HTML views, PDF and ePub downloads, according to the available data) and Abstracts Views on Vision4Press platform.
Data correspond to usage on the plateform after 2015. The current usage metrics is available 48-96 hours after online publication and is updated daily on week days.
Initial download of the metrics may take a while.