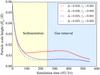
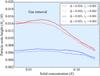
Fig. 2
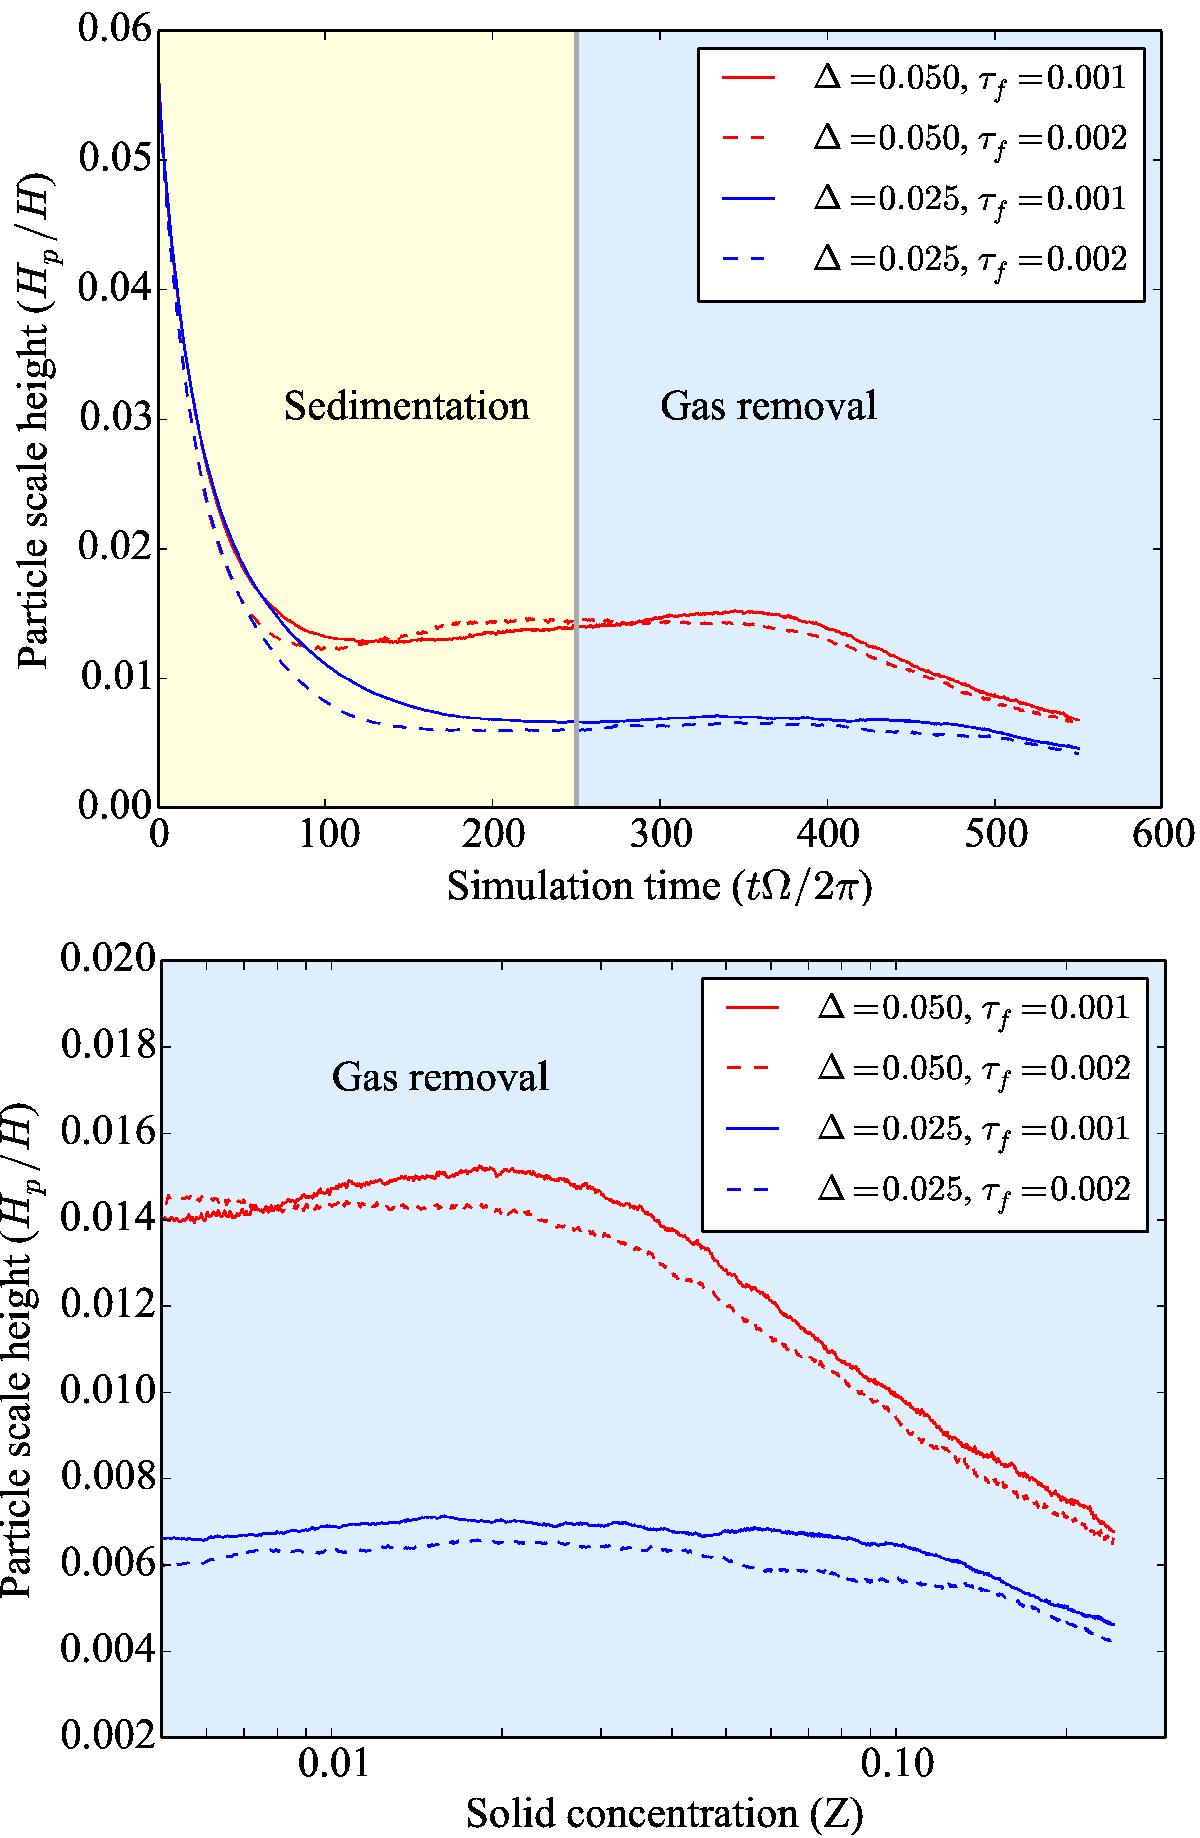
Particle scale height Hp for small particles (size τf ≤ 0.002, R ≤ 1.5 mm) over the course of the simulation. The top figure shows the entire simulation, including the sedimentation phase. After 250 orbits, Hp has reached a steady state and the numerical experiment begins. The bottom figure shows only the gas removal phase. Gas is removed exponentially. In the bottom plot, the simulation time is replaced by the solid concentration Z = Σsolid/ Σtotal. For particles in this size scale, the scale height is determined primarily by Δ, and secondly by Z.
Current usage metrics show cumulative count of Article Views (full-text article views including HTML views, PDF and ePub downloads, according to the available data) and Abstracts Views on Vision4Press platform.
Data correspond to usage on the plateform after 2015. The current usage metrics is available 48-96 hours after online publication and is updated daily on week days.
Initial download of the metrics may take a while.