Fig. B.3
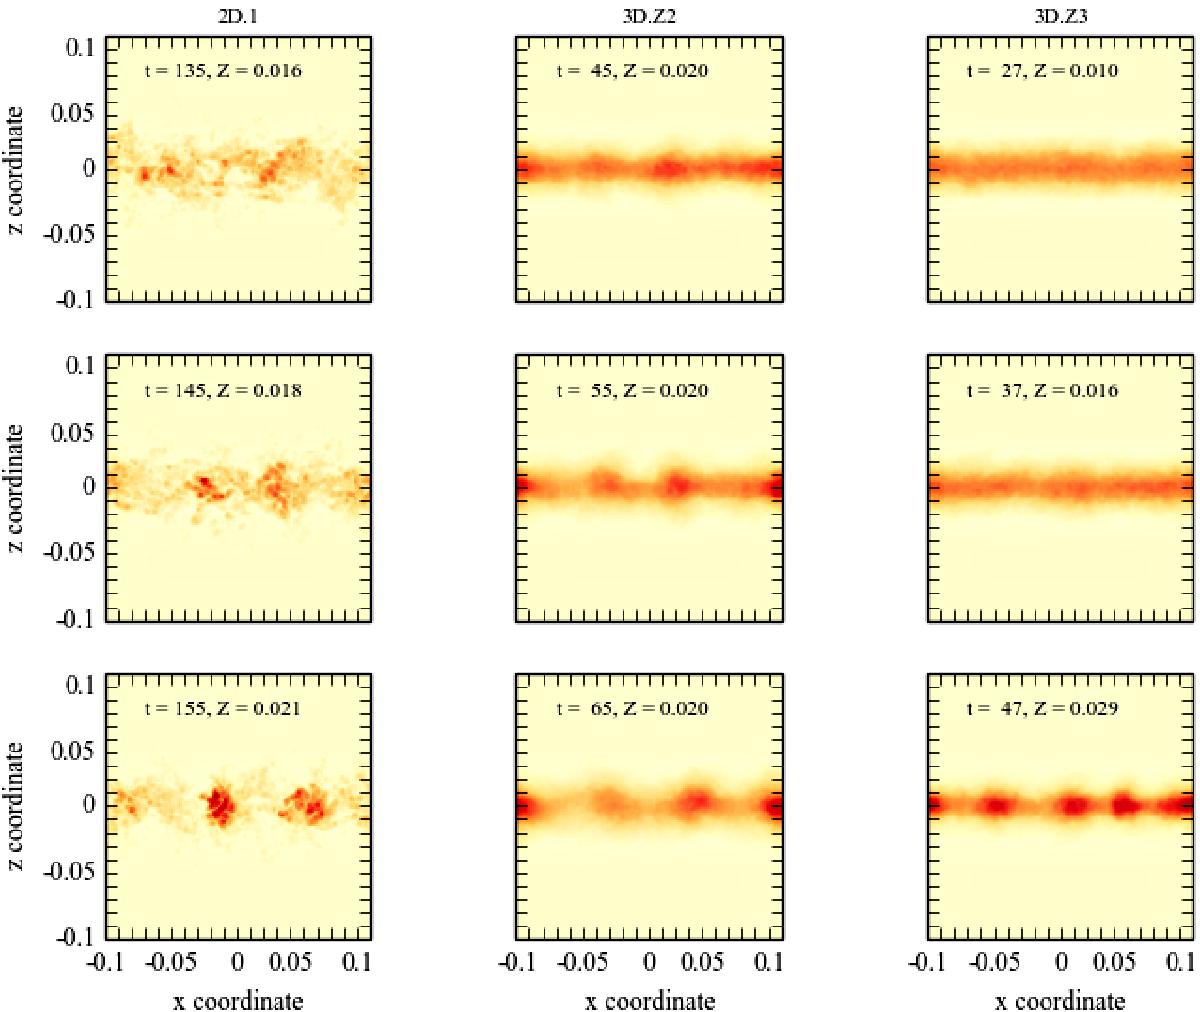
A sequence of vertical snapshots (x-z plane) showing the formation of distinct particle clumps in one of our 2D simulations (left) and our two 3D simulations (middle, right). For each run, the images are taken 10 orbits apart. The time and Z values are shown in each plot. The times were chosen to show the formation of the first distinct clumps, and to give a similar peak density on the final image (ρp,max = 1.8,1.5,2.1left to right). The color indicates the column density using the same color scale as in Fig. B.2a. The other 2D runs give similar results to the one shown. The 2D run is consistent with the 3D runs. In particular, the 3D runs do not show any evidence of additional turbulence stirring compared to the 2D runs.
Current usage metrics show cumulative count of Article Views (full-text article views including HTML views, PDF and ePub downloads, according to the available data) and Abstracts Views on Vision4Press platform.
Data correspond to usage on the plateform after 2015. The current usage metrics is available 48-96 hours after online publication and is updated daily on week days.
Initial download of the metrics may take a while.