Fig. B.2
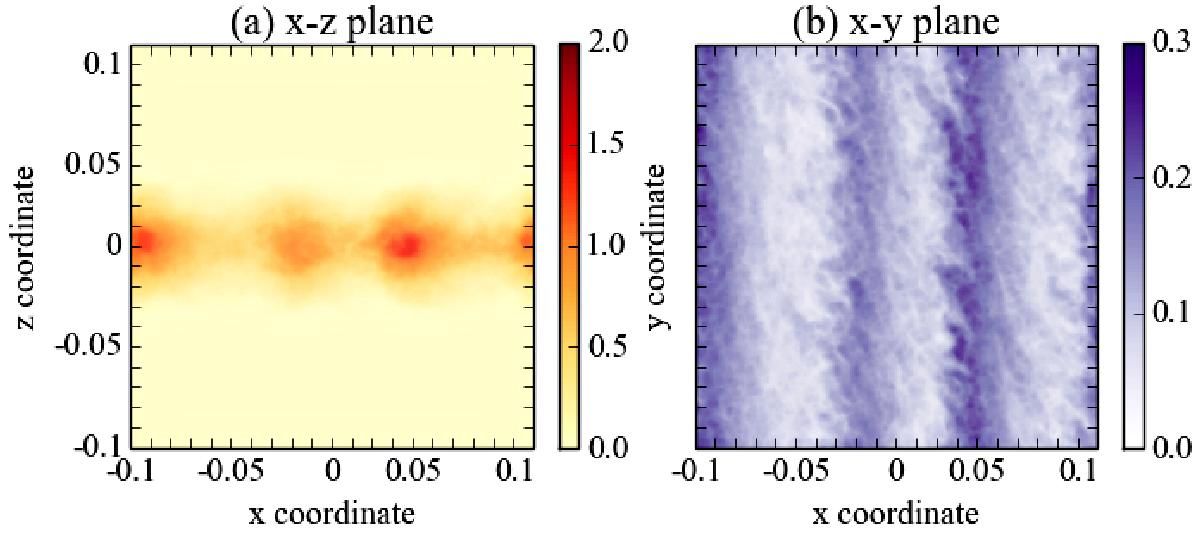
A snapshot of run 3D.Z2 taken at t = 150 orbits (Z = 0.02). Image a) is the view from the side (x − z plane). Image b) is the view from above (x − y plane). The color scale marks the column solid density normalized to the initial gas density (Σsolid/ Σgas,0). The two images have a different color scale, since the column density in the azimuthal direction is much higher. Note that the particle structure is nearly axisymmetric.
Current usage metrics show cumulative count of Article Views (full-text article views including HTML views, PDF and ePub downloads, according to the available data) and Abstracts Views on Vision4Press platform.
Data correspond to usage on the plateform after 2015. The current usage metrics is available 48-96 hours after online publication and is updated daily on week days.
Initial download of the metrics may take a while.