Fig. B.1
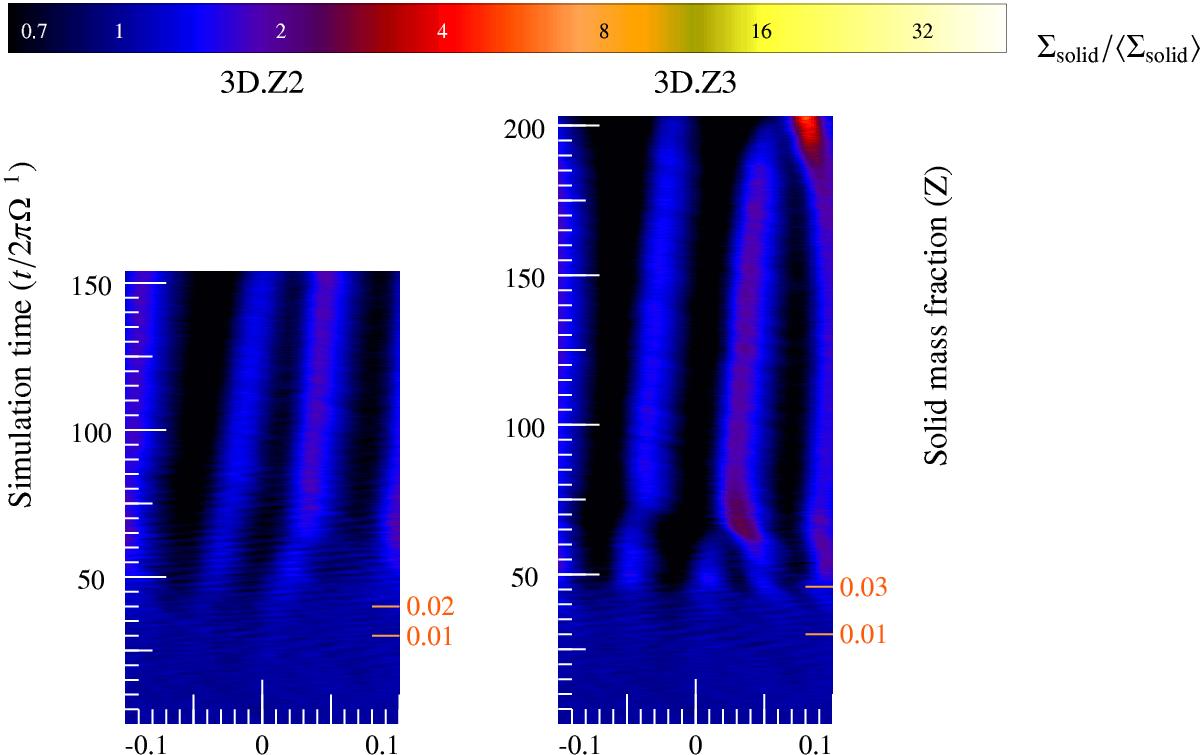
Spacetime diagram of two 3D runs with particle size τf = 0.03 and Δ = 0.05. The color indicates the column density Σsolid/ ⟨ Σsolid ⟩ using the same color bar as Figs. 4 and 5. Both runs begin with Z = 0.01 and have Z increased only for a short interval. In one run (left), Z grows to 0.02 and in the other (right) Z grows to 0.03. Clumps are visible for Z ≥ 0.02, consistent with the 2D runs.
Current usage metrics show cumulative count of Article Views (full-text article views including HTML views, PDF and ePub downloads, according to the available data) and Abstracts Views on Vision4Press platform.
Data correspond to usage on the plateform after 2015. The current usage metrics is available 48-96 hours after online publication and is updated daily on week days.
Initial download of the metrics may take a while.