Fig. A.2
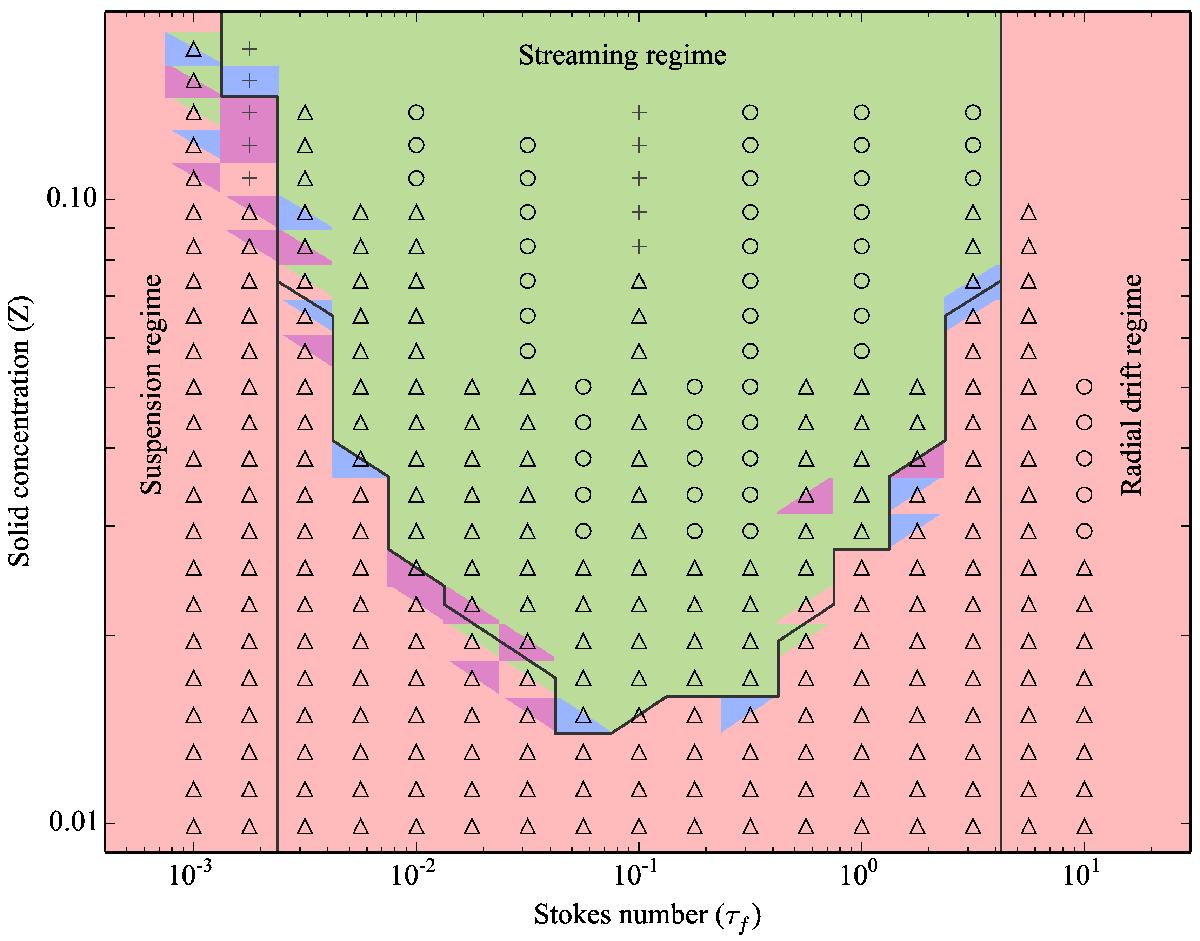
As in Fig. 8, but using the ![]() method to estimate the likelihood of clumping instead of the KS-derived method. The figure marks the region of the particle size vs. concentration phase space where the streaming instability is active. Particle size is measured in the stopping time τf and the particle concentration is Z = Σsolid/ Σtotal. The colors mark the probability that particle clumps can form, where red is “unlikely”, magenta is “somewhat likely”, blue is “likely”, and green is “very likely”. When different simulations give different results, the two extreme values are shown. The symbols indicate the number of simulations available. The circle, cross and triangle indicate, respectively, one, two and three simulations. Regions without symbols are extrapolations. To facilitate the comparison with Fig. 8, the boundary marked by the black lines has been copied from Fig. 8 without modification.
method to estimate the likelihood of clumping instead of the KS-derived method. The figure marks the region of the particle size vs. concentration phase space where the streaming instability is active. Particle size is measured in the stopping time τf and the particle concentration is Z = Σsolid/ Σtotal. The colors mark the probability that particle clumps can form, where red is “unlikely”, magenta is “somewhat likely”, blue is “likely”, and green is “very likely”. When different simulations give different results, the two extreme values are shown. The symbols indicate the number of simulations available. The circle, cross and triangle indicate, respectively, one, two and three simulations. Regions without symbols are extrapolations. To facilitate the comparison with Fig. 8, the boundary marked by the black lines has been copied from Fig. 8 without modification.
Current usage metrics show cumulative count of Article Views (full-text article views including HTML views, PDF and ePub downloads, according to the available data) and Abstracts Views on Vision4Press platform.
Data correspond to usage on the plateform after 2015. The current usage metrics is available 48-96 hours after online publication and is updated daily on week days.
Initial download of the metrics may take a while.